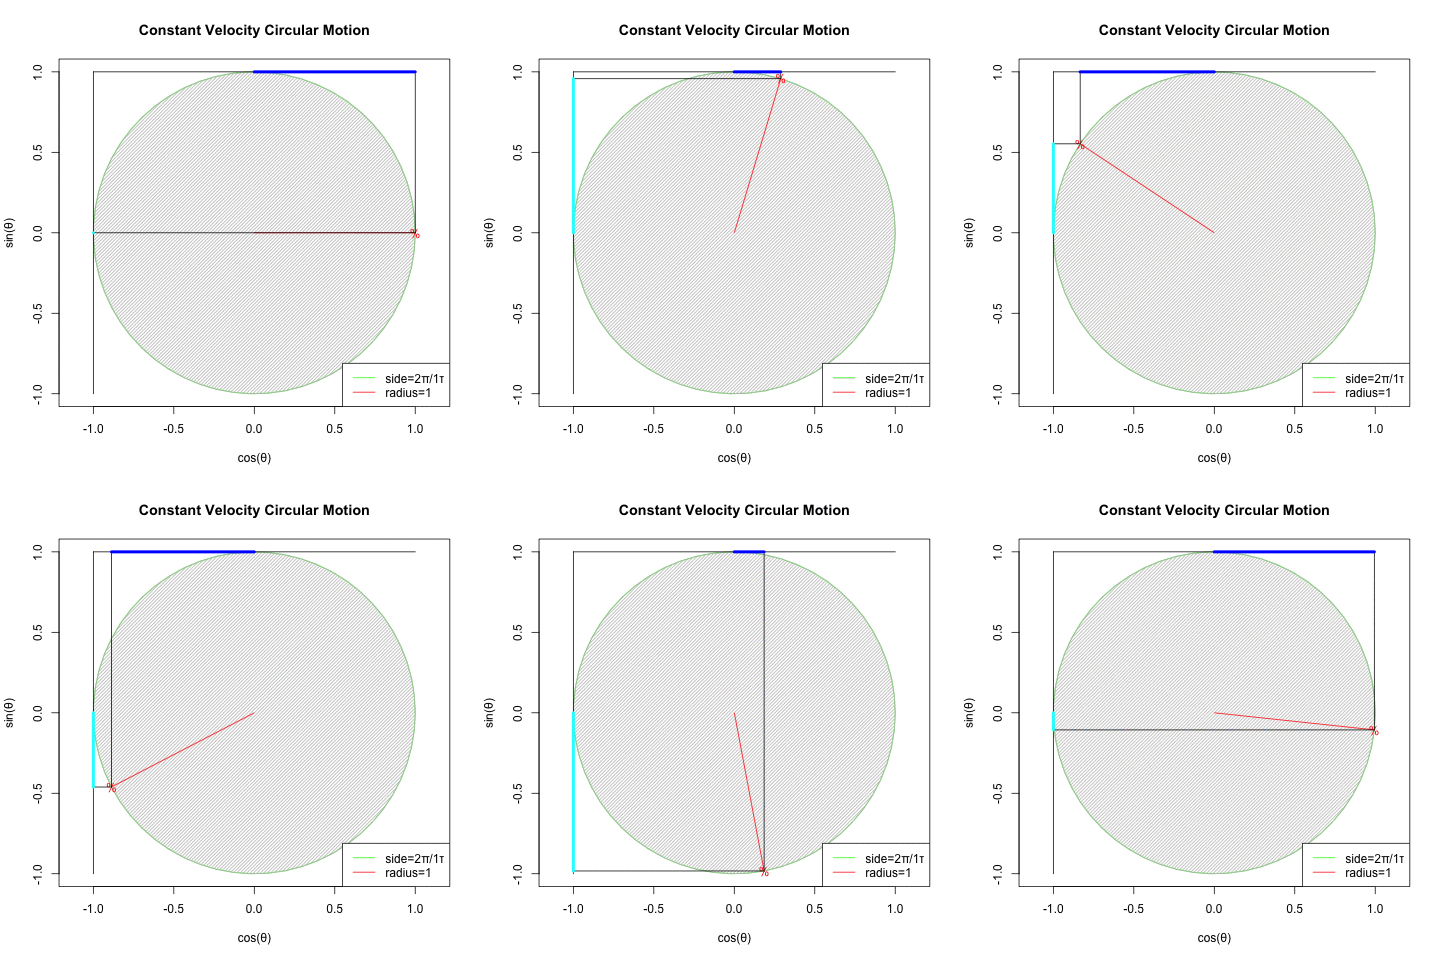
手段は何であれ「X軸にCos波、Y軸にSin波」を配する事さえ思いつけば円は描けてしまいます。そして物理系科学の世界においては、数学世界と異なり以下の様な解釈が主流となっている様なのです。


回転運動を回転面上の観測者が真横から見ると物体は単振動しているように見える。あるいは、物体のx座標とy座標は互いに位相が90度=π/2ずれた単振動を行っている。
振動運動では回転速度のことを周波数または振動数と呼ぶ。
①まず「あらゆる運動の原型の一つ」たる等速円運動(Constant Velocity Circular Motion)を想定する。
#CVCM=等速円運動(Constant Velocity Circular Motion)
#Radian=角度(60分割)
CVCM<-function(Radian){
c0<-seq(0,2*pi,length=60)
cx<-cos(c0)
cy<-sin(c0)
plot(cx,cy,asp=1,type="l",col=rgb(0,1,0),main="Constant Velocity Circular Motion",xlab="cos(θ)",ylab="sin(θ)")#塗りつぶし(円)
polygon(cx, #x
cy, #y
density=c(30), #塗りつぶす濃度
angle=c(45), #塗りつぶす斜線の角度
col=c(200,200,200)) #塗りつぶす色
text(cx[Radian],cy[Radian],"%",col=rgb(1,0,0))segments(cx[Radian],cy[Radian],0,0,col=rgb(1,0,0))
#凡例
legend("bottomright", legend=c("side=2π/1τ","radius=1"), lty=c(1,1), col=c(rgb(0,1,0),rgb(1,0,0)))
}
#アニメーション
library("animation")
Time_Code=seq(1,59, length=30)
saveGIF({
for (i in Time_Code){
CVCM(i)
}
}, interval = 0.1, movie.name = "CVCM01.gif")

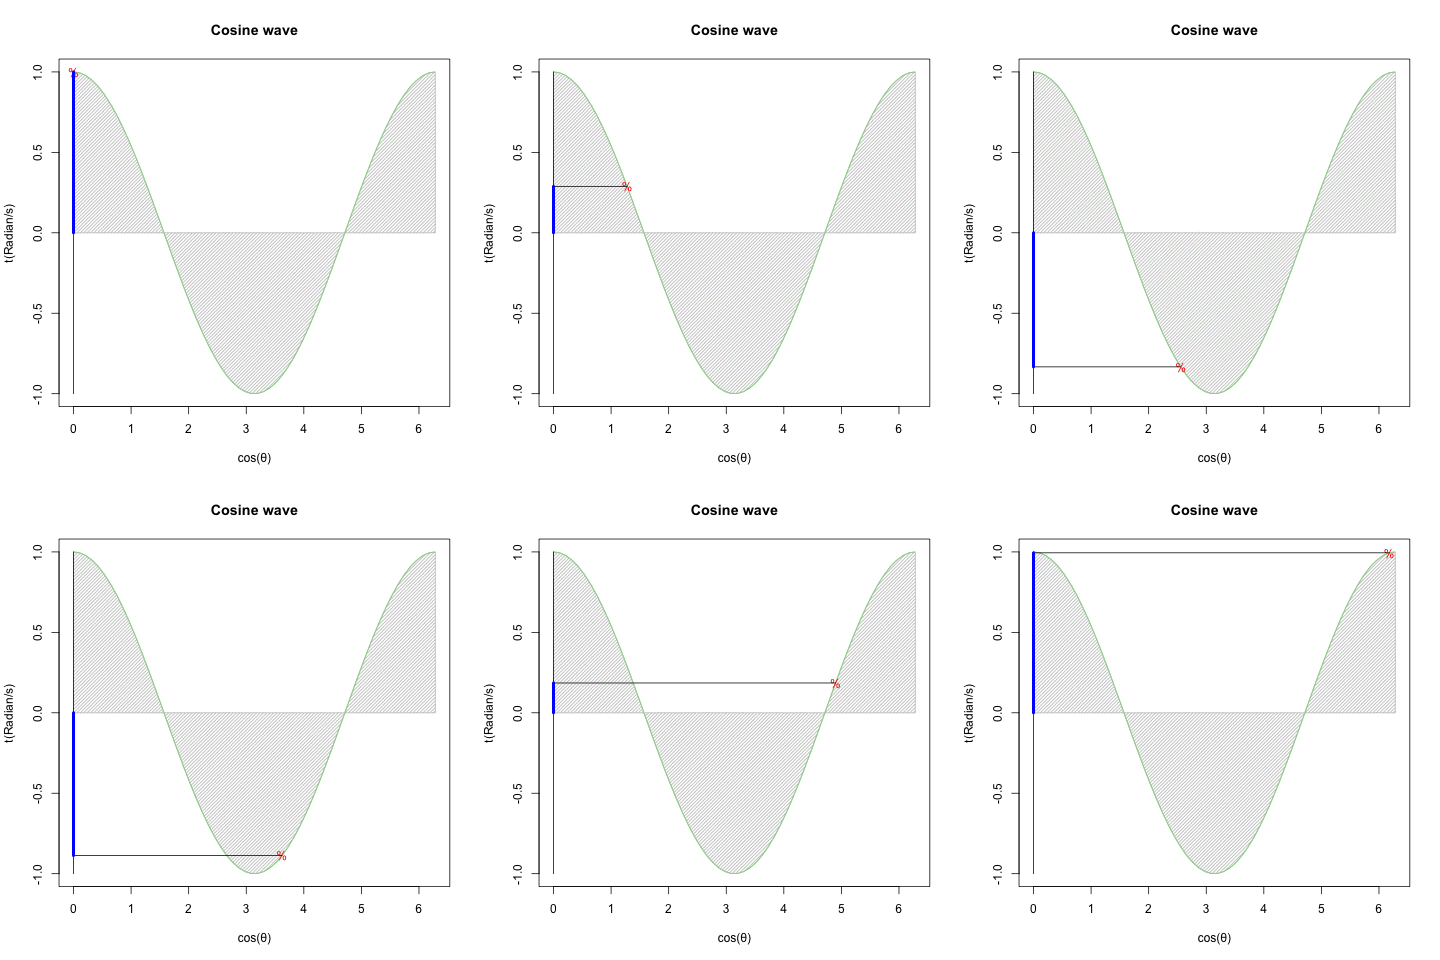
②回転運動を互いに直交するX軸側とY軸側から観測すると、同じ波形が互いに位相が90度=π/2ずれた単振動が得られる(Cos波とSin波)逆にこの組み合わせによって回転運動を説明する事も出来る。
XY軸(円弧)
#CosSin=Cos波とSin波の検出
#Radian=角度(60分割)
CosSin<-function(Radian){
c0<-seq(0,2*pi,length=60)
cx<-cos(c0)
cy<-sin(c0)
plot(cx,cy,asp=1,type="l",col=rgb(0,1,0),main="Constant Velocity Circular Motion",xlab="cos(θ)",ylab="sin(θ)")#塗りつぶし(円)
polygon(cx, #x
cy, #y
density=c(30), #塗りつぶす濃度
angle=c(45), #塗りつぶす斜線の角度
col=c(200,200,200)) #塗りつぶす色
text(cx[Radian],cy[Radian],"%",col=rgb(1,0,0))#補助線
segments(cx[Radian],cy[Radian],0,0,col=rgb(1,0,0))
#Cos
segments(-1,1,1,1,col=rgb(0,0,0))
segments(cx[Radian],cy[Radian],cx[Radian],1,col=rgb(0,0,0))
segments(0,1,cx[Radian],1,col=rgb(0,0,1),lwd =4)
#Sin
segments(-1,1,-1,-1,col=rgb(0,0,0))
segments(cx[Radian],cy[Radian],-1,cy[Radian],col=rgb(0,0,0))
segments(-1,0,-1,cy[Radian],col=rgb(0,1,1),lwd =4)
#凡例
legend("bottomright", legend=c("side=2π/1τ","radius=1"), lty=c(1,1), col=c(rgb(0,1,0),rgb(1,0,0)))
}
#アニメーション
library("animation")
Time_Code=seq(1,59, length=30)
saveGIF({
for (i in Time_Code){
CosSin(i)
}
}, interval = 0.1, movie.name = "CosSin01.gif")

XZ軸(Cos波)
CosCos<-function(Radian){
cx<-seq(0,2*pi,length=60)
cy<-cos(c0)
plot(cx,cy,type="l",col=rgb(0,1,0),ylim=c(-1,1),main="Cosine wave",xlab="cos(θ)",ylab="t(Radian/s)")#塗りつぶし(Cos波)
polygon(c(0,cx,2*pi), #x
c(0,cy,0), #y
density=c(30), #塗りつぶす濃度
angle=c(45), #塗りつぶす斜線の角度
col=c(200,200,200)) #塗りつぶす色
text(cx[Radian],cy[Radian],"%",col=rgb(1,0,0))#補助線
segments(0,-1,0,1,col=rgb(0,0,0))
segments(cx[Radian],cy[Radian],0,cy[Radian],col=rgb(0,0,0))
segments(0,0,0,cy[Radian],col=rgb(0,0,1),lwd =4)
}
#アニメーション
library("animation")
Time_Code=seq(1,59, length=30)
saveGIF({
for (i in Time_Code){
CosCos(i)
}
}, interval = 0.1, movie.name = "CosCos01.gif")

YZ軸(Sin波)
SinSin<-function(Radian){
cx<-seq(0,2*pi,length=60)
cy<-sin(c0)
plot(cx,cy,type="l",col=rgb(0,1,0),ylim=c(-1,1),main="Sine wave",xlab="cos(θ)",ylab="t(Radian/s)")#塗りつぶし(Cos波)
polygon(c(0,cx,2*pi), #x
c(0,cy,0), #y
density=c(30), #塗りつぶす濃度
angle=c(45), #塗りつぶす斜線の角度
col=c(200,200,200)) #塗りつぶす色text(cx[Radian],cy[Radian],"%",col=rgb(1,0,0))
#補助線
segments(0,-1,0,1,col=rgb(0,0,0))
segments(cx[Radian],cy[Radian],0,cy[Radian],col=rgb(0,0,0))
segments(0,0,0,cy[Radian],col=rgb(0,1,1),lwd =4)
}
#アニメーション
library("animation")
Time_Code=seq(1,59, length=30)
saveGIF({
for (i in Time_Code){
SinSin(i)
}
}, interval = 0.1, movie.name = "SinSin01.gif")


③このアプローチにおいては(数学における)角度θの概念が角速度(Angular velocity、単位Radian/S)または周波数(frequency、単位Hz)として検出されるので、最終的に構成されるのも「(空間概念としてのみ意識される)単位円(Unit Circle、半径1)」ではなく「(空間として認識されるZ軸と時間経過として意識されるt軸が可換性を有する)単位円筒(Unit Cylinder、半径1、周期1)」となる。
統計言語Rによる3次元表示
library(rgl)
Rtime<-seq(0,2*pi,length=60)
CosX<-cos(Rtime)
SinY<-sin(Rtime)
plot3d(CosX,SinY,Rtime,type="l",xlim=c(-1,1),ylim=c(-1,1),zlim=c(0,2*pi))
movie3d(spin3d(axis=c(0,0,1),rpm=5),duration=10,fps=25,movie="~/Desktop/test01")

XY軸(円弧)

ZX軸(Cos波)

ZY軸(Sin波)

統計言語Rによる2Dヒストグラム表示
データ生成
z_axis<-seq(1,-1,length=60)
radian_axis<-seq(0,2*pi,length=60)
x_axis<-cos(radian_axis)
y_axis<-sin(radian_axis)
polygon_60 <- data.frame(X=x_axis, Y=y_axis,Z=z_axis)
library(xtable)
print(xtable(round(polygon_60, digits = 6)), type = "html")
| X | Y | Z | |
|---|---|---|---|
| 1 | 1.00 | 0.00 | 1.00 |
| 2 | 0.99 | 0.11 | 0.97 |
| 3 | 0.98 | 0.21 | 0.93 |
| 4 | 0.95 | 0.31 | 0.90 |
| 5 | 0.91 | 0.41 | 0.86 |
| 6 | 0.86 | 0.51 | 0.83 |
| 7 | 0.80 | 0.60 | 0.80 |
| 8 | 0.73 | 0.68 | 0.76 |
| 9 | 0.66 | 0.75 | 0.73 |
| 10 | 0.57 | 0.82 | 0.69 |
| 11 | 0.48 | 0.87 | 0.66 |
| 12 | 0.39 | 0.92 | 0.63 |
| 13 | 0.29 | 0.96 | 0.59 |
| 14 | 0.19 | 0.98 | 0.56 |
| 15 | 0.08 | 1.00 | 0.53 |
| 16 | -0.03 | 1.00 | 0.49 |
| 17 | -0.13 | 0.99 | 0.46 |
| 18 | -0.24 | 0.97 | 0.42 |
| 19 | -0.34 | 0.94 | 0.39 |
| 20 | -0.44 | 0.90 | 0.36 |
| 21 | -0.53 | 0.85 | 0.32 |
| 22 | -0.62 | 0.79 | 0.29 |
| 23 | -0.70 | 0.72 | 0.25 |
| 24 | -0.77 | 0.64 | 0.22 |
| 25 | -0.83 | 0.55 | 0.19 |
| 26 | -0.89 | 0.46 | 0.15 |
| 27 | -0.93 | 0.36 | 0.12 |
| 28 | -0.96 | 0.26 | 0.08 |
| 29 | -0.99 | 0.16 | 0.05 |
| 30 | -1.00 | 0.05 | 0.02 |
| 31 | -1.00 | -0.05 | -0.02 |
| 32 | -0.99 | -0.16 | -0.05 |
| 33 | -0.96 | -0.26 | -0.08 |
| 34 | -0.93 | -0.36 | -0.12 |
| 35 | -0.89 | -0.46 | -0.15 |
| 36 | -0.83 | -0.55 | -0.19 |
| 37 | -0.77 | -0.64 | -0.22 |
| 38 | -0.70 | -0.72 | -0.25 |
| 39 | -0.62 | -0.79 | -0.29 |
| 40 | -0.53 | -0.85 | -0.32 |
| 41 | -0.44 | -0.90 | -0.36 |
| 42 | -0.34 | -0.94 | -0.39 |
| 43 | -0.24 | -0.97 | -0.42 |
| 44 | -0.13 | -0.99 | -0.46 |
| 45 | -0.03 | -1.00 | -0.49 |
| 46 | 0.08 | -1.00 | -0.53 |
| 47 | 0.19 | -0.98 | -0.56 |
| 48 | 0.29 | -0.96 | -0.59 |
| 49 | 0.39 | -0.92 | -0.63 |
| 50 | 0.48 | -0.87 | -0.66 |
| 51 | 0.57 | -0.82 | -0.69 |
| 52 | 0.66 | -0.75 | -0.73 |
| 53 | 0.73 | -0.68 | -0.76 |
| 54 | 0.80 | -0.60 | -0.80 |
| 55 | 0.86 | -0.51 | -0.83 |
| 56 | 0.91 | -0.41 | -0.86 |
| 57 | 0.95 | -0.31 | -0.90 |
| 58 | 0.98 | -0.21 | -0.93 |
| 59 | 0.99 | -0.11 | -0.97 |
| 60 | 1.00 | -0.00 | -1.00 |
X軸-Y軸
*要するに要するに均等な間隔で円弧を描いている。
library(gplots)
polygon_60_hist2d<-function(x){
# 遠近法プロット (persp) のためのデータをhist2d() を使用して作成
h2d <- hist2d(polygon_60$X, polygon_60$Y, show=FALSE, same.scale=TRUE, nbins=c(20,30))
# 遠近法プロット (persp) 描画
persp( h2d$x, h2d$y, h2d$counts,
ticktype="detailed", theta=x, phi=30,
expand=0.5, shade=0.5, col="cyan", ltheta=-30,main="polygon 60 with hist2d()",xlab="x",ylab="y",zlab="counts")}
#アニメーション
library("animation")
Time_Code=seq(0,350,length=36)
saveGIF({
for (i in Time_Code){
polygon_60_hist2d(i)
}
}, interval = 0.1, movie.name = "polygon_60_hist2d.gif")

X軸-Z軸
*要するに均等な感覚でCos波を描いている。
library(gplots)
polygon_60_hist2d<-function(x){
# 遠近法プロット (persp) のためのデータをhist2d() を使用して作成
h2d <- hist2d(polygon_60$X, polygon_60$Z, show=FALSE, same.scale=TRUE, nbins=c(20,30))
# 遠近法プロット (persp) 描画
persp( h2d$x, h2d$y, h2d$counts,
ticktype="detailed", theta=x, phi=30,
expand=0.5, shade=0.5, col="cyan", ltheta=-30,main="polygon 60 with hist2d()",xlab="x",ylab="z",zlab="counts")}
#アニメーション
library("animation")
Time_Code=seq(0,350,length=36)
saveGIF({
for (i in Time_Code){
polygon_60_hist2d(i)
}
}, interval = 0.1, movie.name = "polygon_60_hist2d.gif")

Y軸-Z軸
*要するに要するに均等な間隔でSin波を描いている。
library(gplots)
polygon_60_hist2d<-function(x){
# 遠近法プロット (persp) のためのデータをhist2d() を使用して作成
h2d <- hist2d(polygon_60$Y, polygon_60$Z, show=FALSE, same.scale=TRUE, nbins=c(20,30))
# 遠近法プロット (persp) 描画
persp( h2d$x, h2d$y, h2d$counts,
ticktype="detailed", theta=x, phi=30,
expand=0.5, shade=0.5, col="cyan", ltheta=-30,main="polygon 60 with hist2d()",xlab="y",ylab="z",zlab="counts")}
#アニメーション
library("animation")
Time_Code=seq(0,350,length=36)
saveGIF({
for (i in Time_Code){
polygon_60_hist2d(i)
}
}, interval = 0.1, movie.name = "polygon_60_hist2d.gif")

*統計学的計測手段においては曲線の頂点間近に分布の凝縮が見られる。それが中央ならCos波的分布、周辺ならSin波的分布となり、観察対象の回転に伴って立場の交換が行われる。
X軸のQQプロット検収
qqnorm(polygon_60$X)
qqline(polygon_60$X, lwd=2, col="red" )

Y軸のQQプロット検収
qqnorm(polygon_60$Y)
qqline(polygon_60$Y, lwd=2, col="red" )

Z軸のQQプロット検収
qqnorm(polygon_60$Z)
qqline(polygon_60$Z, lwd=2, col="red" )
