参照が頻出するのでまとめてみました。


①plot関数におけるグラフ種別設定パラメーターについて。
- type="p"...点プロット(デフォルト)
- type="l"...線プロット(折れ線グラフ)
- type="b"...点と線のプロット
- type="c"..."b" において点を描かないプロット
- type="o"...点プロットと線プロットの重ね書き
- type="h"...各点から x 軸までの垂線プロット
- type="s"...左側の値にもとづいて階段状に結ぶ
- type="S"...右側の値にもとづいて階段状に結ぶ
- type="n"...軸だけ描いてプロットしない(続けて低水準関数でプロットする場合)
統計言語Rでの確認例
plot(1:10, 1:10, type="n",main="For Drawing area", axes = FALSE,xaxt="n",yaxt="n",xlab="", ylab="",xaxt="n",yaxt="n")
#ダミーのグラフ描写

#type="p"
plot(seq(-5, 5, length=5),seq*1

以下続報…
*1:-5+15), (5+15), length=5) ,xlim=c(-5,5),ylim=c(-5,20),type="p",lty =1,main="Proting type", xlab="Dots & lines", ylab="Proting type")
#type="l"
par(new=T) # 上書き指定
plot(seq(-5, 5, length=5) ,seq((-5+13),(5+13), length=5), xlim=c(-5,5),ylim=c(-5,20),type="l",lty =1,main="", xlab="", ylab="")
#type="b"
par(new=T) # 上書き指定
plot(seq(-5, 5, length=5) ,seq((-5+11),(5+11), length=5), xlim=c(-5,5),ylim=c(-5,20),type="b",lty =1,main="", xlab="", ylab="")
#type="c"
par(new=T) # 上書き指定
plot(seq(-5, 5, length=5) ,seq((-5+9),(5+9), length=5), xlim=c(-5,5),ylim=c(-5,20),type="c",lty =1,main="", xlab="", ylab="")
#type="o"
par(new=T) # 上書き指定
plot(seq(-5, 5, length=5) ,seq((-5+7),(5+7), length=5), xlim=c(-5,5),ylim=c(-5,20),type="o",lty =1,main="", xlab="", ylab="")
#type="h"
par(new=T) # 上書き指定
plot(seq(-5, 5, length=5) ,seq((-5+5),(5+5), length=5), xlim=c(-5,5),ylim=c(-5,20),type="h",lty =1,main="", xlab="", ylab="")
#type="s"
par(new=T) # 上書き指定
plot(seq(-5, 5, length=5) ,seq((-5+3),(5+3), length=5), xlim=c(-5,5),ylim=c(-5,20),type="s",lty =1,main="", xlab="", ylab="")
#type="S"
par(new=T) # 上書き指定
plot(seq(-5, 5, length=5) ,seq((-5-3),(5-3), length=5), xlim=c(-5,5),ylim=c(-5,20),type="S",lty =1,main="", xlab="", ylab="")

#type="s"
plot(seq(-5, 5, length=5) ,seq((-5+3),(5+3), length=5), xlim=c(-6,6),ylim=c(-6,6),type="s",lty =1,main="Proting type", xlab="Dots & lines", ylab="Proting type")#type="S"
par(new=T) # 上書き指定
plot(seq(-5, 5, length=5) ,seq((-5-3),(5-3), length=5), xlim=c(-6,6),ylim=c(-6,6),type="S",lty =1,main="", xlab="", ylab="")

②同じくplot関数における凡例の位置パラメーターは以下。
#統計言語Rでの確認例
plot(1:10, 1:10, type="n",main="Position of the legend", xlab="", ylab="",xaxt="n",yaxt="n")#ダミーのグラフ描写
legend("topleft",legend="topleft")
legend("top",legend="top")
legend("topright",legend="topright")
legend("left",legend="left")
legend("center",legend="center")
legend("right",legend="right")
legend("bottomleft",legend="bottomleft")
legend("bottom",legend="bottom")
legend("bottomright",legend="bottomright")

③同じくplot関数の凡例で使う点マーカーはpch引数、線種はIty引数で与える。
#統計言語Rでの確認例
plot(1:30, 1:30, type="n",main="The type of points and lines", xlab="", ylab="",xaxt="n",yaxt="n")#ダミーのグラフ描写
legend("topleft",legend=c(1:25),pch=c(1:25),lty =c(1:25),ncol=5)

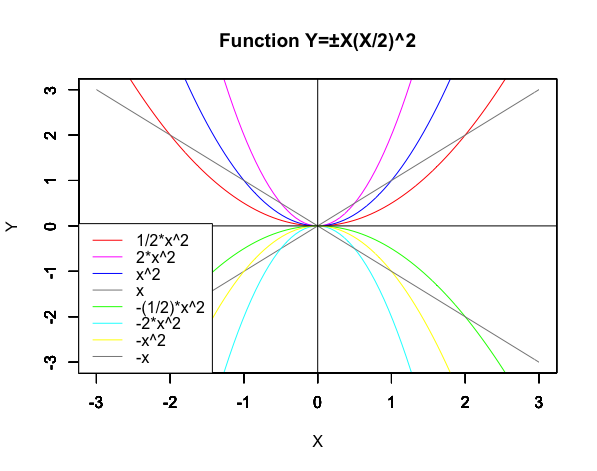
基本テンプレート
統計言語Rでのコーディング例
#関数定義
f1<-function(x){1/2*x^2}
f2<-function(x){2*x^2}
f3<-function(x){x^2}
f4<-function(x){x}
f5<-function(x){-(1/2)*x^2}
f6<-function(x){-2*x^2}
f7<-function(x){-x^2}
f8<-function(x){-x}
#凡例用関数名定義
f1_name<-c("1/2*x^2")
f2_name<-c("2*x^2")
f3_name<-c("x^2")
f4_name<-c("x")
f5_name<-c("-(1/2)*x^2")
f6_name<-c("-2*x^2")
f7_name<-c("-x^2")
f8_name<-c("-x")#グラフのスケール決定
gs_x<-c(-3,3)
gs_y<-c(-3,3)
#グラフの色の決定
Black<-rgb(0,0,0)
Red<-rgb(1,0,0)
Magenta<-rgb(1,0,1)
Blue<-rgb(0,0,1)
Green<-rgb(0,1,0)
Cyan<-rgb(0,1,1)
Yellow<-rgb(1,1,0)
Gray<-"#888888"#タイトル定義
Main_title<-c("Function Y=±X(X/2)^2")
x_title<-c("X")
y_title<-c("Y")
#グラフ描画
plot(f1,xlim=gs_x,ylim=gs_y,type="l",col=Red, main=Main_title,xlab=x_title,ylab=y_title)
par(new=T)#上書き指定
plot(f2,xlim=gs_x,ylim=gs_y,type="l",col=Magenta, main="",xlab="",ylab="")
par(new=T)#上書き指定
plot(f3,xlim=gs_x,ylim=gs_y,type="l",col=Blue, main="",xlab="",ylab="")
par(new=T)#上書き指定
plot(f4,xlim=gs_x,ylim=gs_y,type="l",col=Gray, main="",xlab="",ylab="")
par(new=T)#上書き指定
plot(f5,xlim=gs_x,ylim=gs_y,type="l",col=Green, main="",xlab="",ylab="")
par(new=T)#上書き指定
plot(f6,xlim=gs_x,ylim=gs_y,type="l",col=Cyan, main="",xlab="",ylab="")
par(new=T)#上書き指定
plot(f7,xlim=gs_x,ylim=gs_y,type="l",col=Yellow, main="",xlab="",ylab="")
par(new=T)#上書き指定
plot(f8,xlim=gs_x,ylim=gs_y,type="l",col=Gray, main="",xlab="",ylab="")#基準線
abline(h=0)
abline(v=0)
#凡例描画legend("bottomleft", legend=c(f1_name,f2_name,f3_name,f4_name,f5_name,f6_name,f7_name,f8_name),lty=c(1,1,1,1,1,1,1,1),col=c(Red,Magenta,Blue,Gray,Green,Cyan,Yellow,Gray