三角関数といえばベクトルがらみですぐに内積の話などに移ってしまいますが、実は普段見て見ぬ振りをしてやり過ごしてる数字の動きに思わぬ深い意味があったという話…

三角比範囲内におけるコサイン波とサイン波の振る舞いの全体像(その1)

f0<-function(x){cos(x)}
plot(f0,col=rgb(0,0,1),xlim=c(0,pi/2),ylim=c(0,sqrt(2)),main="Three square theorem",xlab="radian(π)",ylab="Amplitude")
par(new=T) #上書き
f1<-function(x){sin(x)}
plot(f1,col=rgb(0,1,0),xlim=c(0,pi/2),ylim=c(0,sqrt(2)),main="",xlab="",ylab="")
par(new=T) #上書き
f2<-function(x){cos(x)+sin(x)}
plot(f2,col=rgb(1,0,0),xlim=c(0,pi/2),ylim=c(0,sqrt(2)),main="",xlab="",ylab="")
par(new=T) #上書き
f3<-function(x){cos(x)*sin(x)}
plot(f3,col=rgb(0,1,1),xlim=c(0,pi/2),ylim=c(0,sqrt(2)),main="",xlab="",ylab="")par(new=T) #上書き
f4<-function(x){sqrt(cos(x)^2+sin(x)^2)}
plot(f4,col=rgb(0,0,0),xlim=c(0,pi/2),ylim=c(0,sqrt(2)),main="",xlab="",ylab="")
legend("bottomright", legend=c("y=cos(θ)","y=sin(θ)","y=cos(θ)+sin(θ)","y=cos(θ)*sin(θ)","y=(sqrt(cos(θ)+sin(θ)^2)"), lty=c(1,1,1,1,1), col=c(rgb(0,0,1),rgb(0,1,0),rgb(1,0,0),rgb(0,1,1),rgb(0,0,0)))
三角比範囲内におけるy=cos(θ)+sin(θ)の振る舞い。

コサイン波とサイン波の振る舞いの全体像におけるy=cos(θ)*sin(θ)の振る舞い。
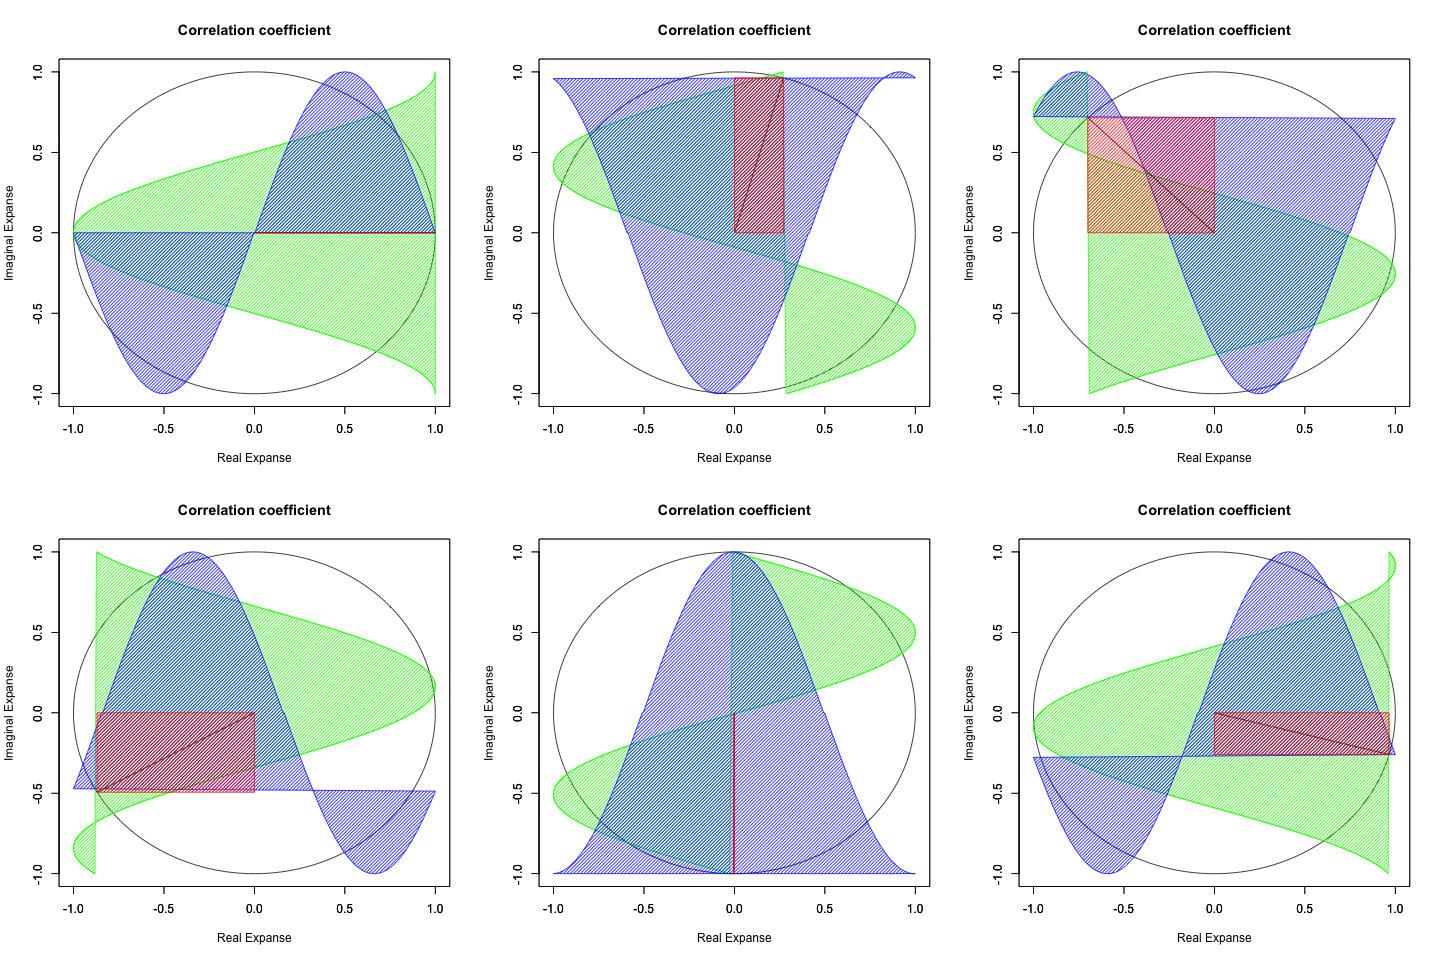
統計言語Rによる作図例
#複素平面(球面)
Complex_plane<-function(x){
ifelse*1
theta <- c(seq(0, pi, length=180),seq(-pi, 0, length=180))
dr<-seq(0,2*pi,length=360)theta00<- seq(1, -1, length=360)
theta01 <- c(theta[x:360],theta[1:x-1])
theta_cos<-cos(theta01)
theta_sin<-sin(theta01)
plot(cos(theta), sin(theta), xlim=c(-1,1), ylim=c(-1,1), type="l", main="Correlation coefficient",xlab="Real Expanse", ylab="Imaginal Expanse")
par(new=T)#上書き指定
plot(theta_cos,theta00,xlim=c(-1,1), ylim=c(-1,1), type="l",col=rgb(0,1,0),main="",xlab="", ylab="")
#cos(x)を塗りつぶす
polygon(theta_cos, #x
theta00, #y
density=c(30), #塗りつぶす濃度
angle=c(45), #塗りつぶす斜線の角度
col=rgb(0,1,0)) #塗りつぶす色
#sin(x)を塗りつぶす
polygon(theta00, #x
theta_sin, #y
density=c(30), #塗りつぶす濃度
angle=c(45), #塗りつぶす斜線の角度
col=rgb(0,0,1)) #塗りつぶす色
#線を引く
segments(cos(dr[x]),sin(dr[x]),0,0,rgb(0,0,0))
#Cosθ+Sinθを塗りつぶす
polygon(c(0,cos(dr[x]),cos(dr[x]),0,0), #x
c(0,0,sin(dr[x]),sin(dr[x]),0), #y
density=c(30), #塗りつぶす濃度
angle=c(45), #塗りつぶす斜線の角度
col=rgb(1,0,0)) #塗りつぶす色
#凡例
#legend("bottomleft", legend=c("cos","sin", "cosθ & sinθ"), lty=c(1,1,1),col =c(rgb(0,1,0),rgb(0,0,1),rgb(0,1,1))
}
#アニメーションさせてみる。library("animation")
Time_Code=c(1,15,30,45,60,75,90,105,120,135,150,165,180,195,210,225,240,255,270,285,300,315,330,345)
saveGIF({
for (i in Time_Code){
Complex_plane(i)
}
}, interval = 0.1, movie.name = "TEST001.gif")
とにかく頭に入れておくべきはこの表。
統計言語Rによる作表例
theta<-c(0,"π/4","π/2","2π/4","π","5π/4","3/2π","7π/4","2π")
Cos_Theta<-c(1,"sqrt(2)/2","0","-sqrt(2)/2","-1","-sqrt(2)/2",0,"sqrt(2)/2",1)
Sin_Theta<-c(0,"sqrt(2)/2",1,"sqrt(2)/2",0,"-sqrt(2)/2",1,"-sqrt(2)/2",0)
Cos_Plus_Sin<-c("1","sqrt(2)",1,"sqrt(2)",1,"sqrt(2)",1,"sqrt(2)",1)CPS<-data.frame(Theta=theta, Cos=Cos_Theta, Sin=Sin_Theta, Cos_plus_Sin=Cos_Plus_Sin)
library(xtable)
print(xtable(CPS), type = "html")
| Theta | Cos | Sin | Cos_plus_Sin | |
|---|---|---|---|---|
| 1 | 0 | 1 | 0 | 1 |
| 2 | π/4 | sqrt(2)/2 | sqrt(2)/2 | sqrt(2) |
| 3 | π/2 | 0 | 1 | 1 |
| 4 | 2π/4 | -sqrt(2)/2 | sqrt(2)/2 | sqrt(2) |
| 5 | π | -1 | 0 | 1 |
| 6 | 5π/4 | -sqrt(2)/2 | -sqrt(2)/2 | sqrt(2) |
| 7 | 3/2π | 0 | 1 | 1 |
| 8 | 7π/4 | sqrt(2)/2 | -sqrt(2)/2 | sqrt(2) |
| 9 | 2π | 1 | 0 | 1 |
「ピタゴラスの定理」を普遍化したcos(θ)^2+sin(θ)^2=1の関数上の証明は以下。
三角比範囲内におけるコサイン波とサイン波の振る舞いの全体像(その2)

統計言語Rによる作図
f0<-function(x){cos(x)^2}
plot(f0,col=rgb(0,0,1),xlim=c(0,2*pi),ylim=c(0,1),main="Three square theorem",xlab="radian(π)",ylab="Amplitude")
par(new=T) #上書き
f1<-function(x){sin(x)^2}
plot(f1,col=rgb(0,1,0),xlim=c(0,2*pi),ylim=c(0,1),main="",xlab="",ylab="")
par(new=T) #上書き
f2<-function(x){cos(x)^2+sin(x)^2}
plot(f2,,col=rgb(1,0,0),xlim=c(0,2*pi),ylim=c(0,1),main="",xlab="",ylab="")
legend("bottomright", legend=c("y=cos(θ)^2","y=sin(θ)^2","y=cos(θ)^2+sin(θ)^2"), lty=c(1,1,1), col=c(rgb(0,0,1),rgb(0,1,0),rgb(1,0,0)))
ここで気をつけて欲しいのが以下。
- cos(θ)^2+sin(θ)^2=sqrt(cos(θ)^2+sin(θ)^2)=1
つまりx=1の場合のみ以下が成立するという条件。
- x^2+y^2=sqrt(x^2+y^2)
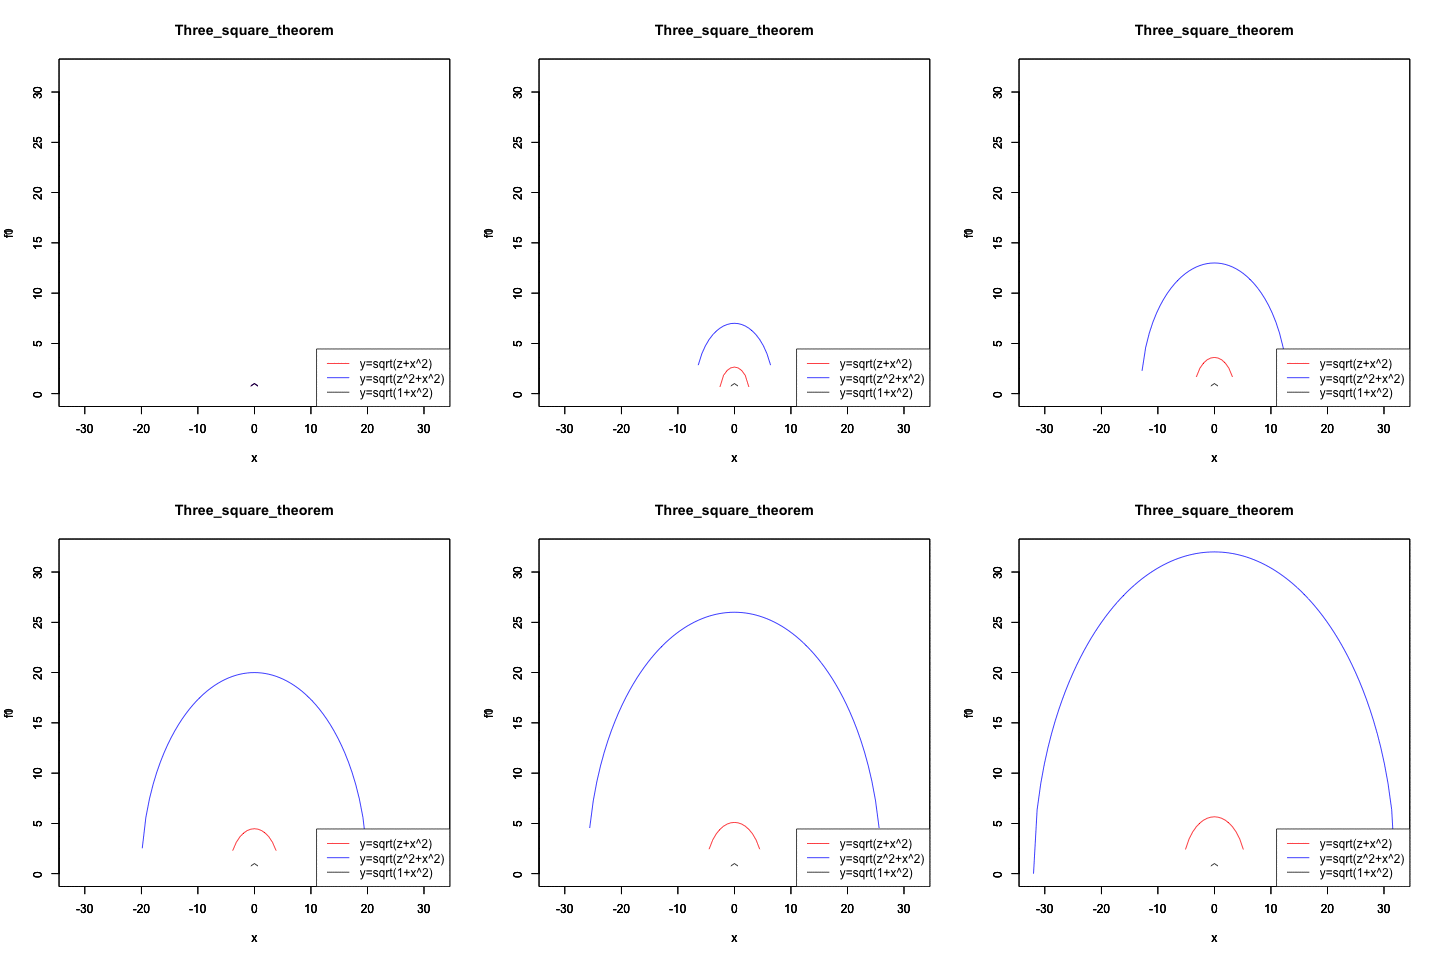
統計言語Rによる検証例(拡大するに連れ差が二乗で開く)
Three_square_theorem<-function(radiusX){
f0<-function(x){sqrt(radiusX-x^2)}
plot(f0,col=rgb(1,0,0),xlim=c(-32,32),ylim=c(0,32),main="Three_square_theorem")
par(new=T) #上書き
f1<-function(x){sqrt(radiusX^2-x^2)}
plot(f1,col=rgb(0,0,1),xlim=c(-32,32),ylim=c(0,32),main="")
par(new=T) #上書き
f1<-function(x){sqrt(1-x^2)}
plot(f1,col=rgb(0,0,0),xlim=c(-32,32),ylim=c(0,32),main="")
legend("bottomright", legend=c("y=sqrt(z+x^2)","y=sqrt(z^2+x^2)","y=sqrt(1+x^2)"), lty=c(1,1,1), col=c(rgb(1,0,0),rgb(0,0,1),rgb(0,0,0)))
}library("animation")
Time_Code=c(seq(1,32))
saveGIF({
for (i in Time_Code){
Three_square_theorem(i)
}
}, interval = 0.1, movie.name = "TEST03.gif")

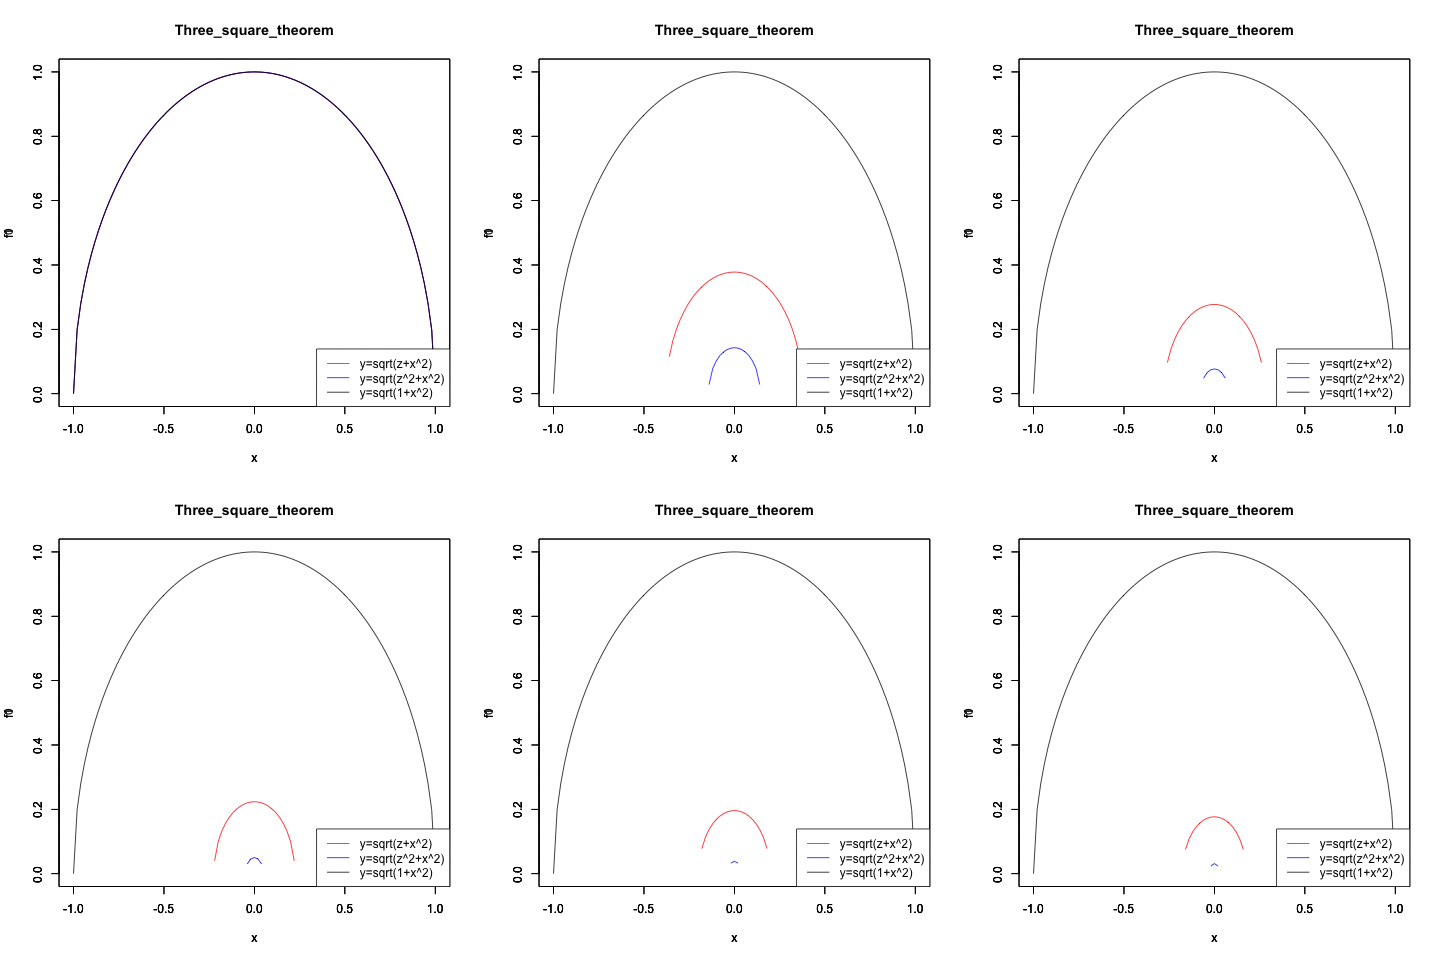
統計言語Rによる検証例(拡大するに連れ差が二乗で開く)
Three_square_theorem<-function(radiusX){
f0<-function(x){sqrt(radiusX-x^2)}
plot(f0,col=rgb(1,0,0),xlim=c(-1,1),ylim=c(0,1),main="Three_square_theorem")
par(new=T) #上書き
f1<-function(x){sqrt(radiusX^2-x^2)}
plot(f1,col=rgb(0,0,1),xlim=c(-1,1),ylim=c(0,1),main="")
par(new=T) #上書き
f1<-function(x){sqrt(1-x^2)}
plot(f1,col=rgb(0,0,0),xlim=c(-1,1),ylim=c(0,1),main="")
legend("bottomright", legend=c("y=sqrt(z+x^2)","y=sqrt(z^2+x^2)","y=sqrt(1+x^2)"), lty=c(1,1,1), col=c(rgb(1,0,0),rgb(0,0,1),rgb(0,0,0)))
}library("animation")
Time_Code=c(1/seq(1,32))
saveGIF({
for (i in Time_Code){
Three_square_theorem(i)
}
}, interval = 0.1, movie.name = "TEST04.gif")

ところでここで統計の基礎知識を振り返ってみましょう。
ピタゴラスの定理と対応させてみましょう。
- 「平均の計算」は(原点からのズレを表す)定数項の算出。
Avr=(A1+A2…An-1+An)/N-1 - 「標本数値から平均を引く計算」は、円の中心を原点に初期化する行為。
((A1-Avr)^2+(A2-Avr)^2+(An-1-Avr)^2+(An-Avr)^2)/N - 「標準分散の算出」は円の半径を割り出す行為。
おやおや?