オイラーの公式(Euler's formula)exp(x*(0+1i))=cos(x)+sin(x*(0+1i))に従って円弧が描かれる時、実は元となる指数関数±exp(x*(0+1i))や対数関数±log(x*(0+1i))も、こんな見慣れない形をしてるのです。

というか実際「(挙動がコサイン関数と全く同じ)複素数関数の実部」のグラフですから、その振る舞いがコサイン関数そっくりとなるのは当然の事とも。マクローリン変換による近似過程でも確かめられる事です。

統計言語Rによる実演例
#タイトル定義
Main_title<-c("Euler's formula")
x_title<-c("Real Expanse")
y_title<-c("Imaginaly Expanse")
#関数定義
f1<-function(x){exp(x*(0+1i))}
theta <- c(seq(0, pi, length=180),seq(-pi, 0, length=180))
Circle_x=Im(f1(theta))
Circle_y=Re(f1(theta))f2<-function(x){-exp(x*(0+1i))}
f3<-function(x){log(x*(0+1i))}
cnv_y <- c(seq(-3, 3, length=300))
Log_plus <- f1(cnv_y)
f4<-function(x){-log(x*(0+1i))}
Log_minus <-f2(cnv_y)
#f5<-function(x){2*x^2}
#f6<-function(x){x^2}
#f7<-function(x){4*x+5}
#凡例用関数名定義
f1_name<-c("e^xi(x=Real,y=Imaginaly),r=1")
f2_name<-c("Exponential e^xi,-e^xi")
f3_name<-c("Logarithmic log(xi),-log(xi)")
#f4_name<-c("2*(x-3)^2")
#f5_name<-c("2*x^2")
#f6_name<-c("x^2")#グラフのスケール決定
gs_x<-c(-1.7,1.7)
gs_y<-c(-1.7,1.7)
#グラフの色の決定
Black<-rgb(0,0,0)
Red<-rgb(1,0,0)
Magenta<-rgb(1,0,1)
Blue<-rgb(0,0,1)
Green<-rgb(0,1,0)
Cyan<-rgb(0,1,1)
Yellow<-rgb(1,1,0)
Gray<-"#777777"
#グラフ描画
plot(Circle_x,Circle_y,xlim=gs_x,ylim=gs_y,type="l",col=Black, main=Main_title,xlab=x_title,ylab=y_title)
par(new=T)#上書き指定
plot(f1,xlim=gs_x,ylim=gs_y,type="l",col=Blue, main="",xlab="",ylab="")
par(new=T)#上書き指定
plot(f2,xlim=gs_x,ylim=gs_y,type="l",col=Blue, main="",xlab="",ylab="")
par(new=T)#上書き指定
plot(Log_plus, cnv_y,xlim=gs_x,ylim=gs_y,type="l",col=Green, main="",xlab="",ylab="")
par(new=T)#上書き指定
plot(Log_minus,cnv_y,xlim=gs_x,ylim=gs_y,type="l",col=Green, main="",xlab="",ylab="")
par(new=T)#上書き指定
#plot(Circle_x*sqrt(2.5),Circle_y*sqrt(2.5),xlim=gs_x,ylim=gs_y,type="l",col=Gray, main="",xlab="",ylab="")
#par(new=T)#上書き指定
#plot(f6,xlim=gs_x,ylim=gs_y,type="l",col=Yellow, main="",xlab="",ylab="")
#par(new=T)#上書き指定
#plot(f7,xlim=gs_x,ylim=gs_y,type="l",col=Blue, main="",xlab="",ylab="")#基準線
abline(h=0,,col=Gray)
abline(v=0,,col=Gray)
#凡例描画legend("bottomleft", legend=c(f1_name,f2_name,f3_name),lty=c(1,1,1),col=c(Black,Blue,Green))
#legend("bottomleft", #legend=c(f1_name,f2_name,f3_name,f4_name,f5_name,f6_name),lty=c(1,1,1,1,1,1),col=c(Red,Magenta,Blue,Green,Cyan,Yellow))
以前から気になっていたのが、この特徴が(内接する円と外接する円の差が0になる点で、それ自体が極限値の一つでもある)指数関数pi^xや対数関数log(x,base=pi)から継承された特質かもしれないという事です。底(root)のズレもpi(3.141593)とネイピア数e(2.718282)では0.4233108程度で、実際ここまで円に肉薄する動きを見せるのです。ちょっと下が欠けてしまいますが…
統計言語Rによる実演例
#タイトル定義
Main_title<-c("Alternative to π^x")
x_title<-c("Real Expanse")
y_title<-c("Imaginaly Expanse")
#関数定義
f1<-function(x){pi^(x*(0+1i))}
theta <- c(seq(0, pi, length=180),seq(-pi, 0, length=180))
Circle_x=Im(f1(theta))
Circle_y=Re(f1(theta))f2<-function(x){-pi^(x*(0+1i))}
f3<-function(x){log(x*(0+1i))}
cnv_y <- c(seq(-3, 3, length=300))
Log_plus <- f1(cnv_y)
f4<-function(x){-log(x*(0+1i))}
Log_minus <-f2(cnv_y)
#f5<-function(x){2*x^2}
#f6<-function(x){x^2}
#f7<-function(x){4*x+5}
#凡例用関数名定義
f1_name<-c("π^xi(x=Real,y=Imaginaly),r=1")
f2_name<-c("Exponential π^xi,-π^xi")
f3_name<-c("Logarithmic log(xi, base=π),-log(xi, base=π)")
#f4_name<-c("2*(x-3)^2")
#f5_name<-c("2*x^2")
#f6_name<-c("x^2")#グラフのスケール決定
gs_x<-c(-1.7,1.7)
gs_y<-c(-1.7,1.7)
#グラフの色の決定
Black<-rgb(0,0,0)
Red<-rgb(1,0,0)
Magenta<-rgb(1,0,1)
Blue<-rgb(0,0,1)
Green<-rgb(0,1,0)
Cyan<-rgb(0,1,1)
Yellow<-rgb(1,1,0)
Gray<-"#777777"
#グラフ描画
plot(Circle_x,Circle_y,xlim=gs_x,ylim=gs_y,type="l",col=Black, main=Main_title,xlab=x_title,ylab=y_title)
par(new=T)#上書き指定
plot(f1,xlim=gs_x,ylim=gs_y,type="l",col=Blue, main="",xlab="",ylab="")
par(new=T)#上書き指定
plot(f2,xlim=gs_x,ylim=gs_y,type="l",col=Blue, main="",xlab="",ylab="")
par(new=T)#上書き指定
plot(Log_plus, cnv_y,xlim=gs_x,ylim=gs_y,type="l",col=Green, main="",xlab="",ylab="")
par(new=T)#上書き指定
plot(Log_minus,cnv_y,xlim=gs_x,ylim=gs_y,type="l",col=Green, main="",xlab="",ylab="")
par(new=T)#上書き指定
#plot(Circle_x*sqrt(2.5),Circle_y*sqrt(2.5),xlim=gs_x,ylim=gs_y,type="l",col=Gray, main="",xlab="",ylab="")
#par(new=T)#上書き指定
#plot(f6,xlim=gs_x,ylim=gs_y,type="l",col=Yellow, main="",xlab="",ylab="")
#par(new=T)#上書き指定
#plot(f7,xlim=gs_x,ylim=gs_y,type="l",col=Blue, main="",xlab="",ylab="")#基準線
abline(h=0,,col=Gray)
abline(v=0,,col=Gray)
#凡例描画legend("bottomleft", legend=c(f1_name,f2_name,f3_name),lty=c(1,1,1),col=c(Black,Blue,Green))
#legend("bottomleft", #legend=c(f1_name,f2_name,f3_name,f4_name,f5_name,f6_name),lty=c(1,1,1,1,1,1),col=c(Red,Magenta,Blue,Green,Cyan,Yellow))
もっと大胆に、例えば底(root)を2辺りにまで小さくしてみたら?
統計言語Rによる実演例
#タイトル定義
Main_title<-c("Alternative to 2^x")
x_title<-c("Real Expanse")
y_title<-c("Imaginaly Expanse")
#関数定義
f1<-function(x){2^(x*(0+1i))}
theta <- c(seq(0, pi, length=180),seq(-pi, 0, length=180))
Circle_x=Im(f1(theta))
Circle_y=Re(f1(theta))f2<-function(x){-2^(x*(0+1i))}
#f3<-function(x){log(x*(0+1i))}
cnv_y <- c(seq(-3, 3, length=300))
Log_plus <- f1(cnv_y)
#f4<-function(x){-log(x*(0+1i))}
Log_minus <-f2(cnv_y)
#f5<-function(x){2*x^2}
#f6<-function(x){x^2}
#f7<-function(x){4*x+5}
#凡例用関数名定義
f1_name<-c("2^xi(x=Real,y=Imaginaly),r=1")
f2_name<-c("Exponential 2^xi,-2^xi")
f3_name<-c("Logarithmic log(xi, base=2),-log(xi, base=2)")
#f4_name<-c("2*(x-3)^2")
#f5_name<-c("2*x^2")
#f6_name<-c("x^2")#グラフのスケール決定
gs_x<-c(-1.7,1.7)
gs_y<-c(-1.7,1.7)
#グラフの色の決定
Black<-rgb(0,0,0)
Red<-rgb(1,0,0)
Magenta<-rgb(1,0,1)
Blue<-rgb(0,0,1)
Green<-rgb(0,1,0)
Cyan<-rgb(0,1,1)
Yellow<-rgb(1,1,0)
Gray<-"#777777"
#グラフ描画
plot(Circle_x,Circle_y,xlim=gs_x,ylim=gs_y,type="l",col=Black, main=Main_title,xlab=x_title,ylab=y_title)
par(new=T)#上書き指定
plot(f1,xlim=gs_x,ylim=gs_y,type="l",col=Blue, main="",xlab="",ylab="")
par(new=T)#上書き指定
plot(f2,xlim=gs_x,ylim=gs_y,type="l",col=Blue, main="",xlab="",ylab="")
par(new=T)#上書き指定
plot(Log_plus, cnv_y,xlim=gs_x,ylim=gs_y,type="l",col=Green, main="",xlab="",ylab="")
par(new=T)#上書き指定
plot(Log_minus,cnv_y,xlim=gs_x,ylim=gs_y,type="l",col=Green, main="",xlab="",ylab="")
par(new=T)#上書き指定
#plot(Circle_x*sqrt(2.5),Circle_y*sqrt(2.5),xlim=gs_x,ylim=gs_y,type="l",col=Gray, main="",xlab="",ylab="")
#par(new=T)#上書き指定
#plot(f6,xlim=gs_x,ylim=gs_y,type="l",col=Yellow, main="",xlab="",ylab="")
#par(new=T)#上書き指定
#plot(f7,xlim=gs_x,ylim=gs_y,type="l",col=Blue, main="",xlab="",ylab="")#基準線
abline(h=0,,col=Gray)
abline(v=0,,col=Gray)
#凡例描画legend("bottomleft", legend=c(f1_name,f2_name,f3_name),lty=c(1,1,1),col=c(Black,Blue,Green))
#legend("bottomleft", #legend=c(f1_name,f2_name,f3_name,f4_name,f5_name,f6_name),lty=c(1,1,1,1,1,1),col=c(Red,Magenta,Blue,Green,Cyan,Yellow))

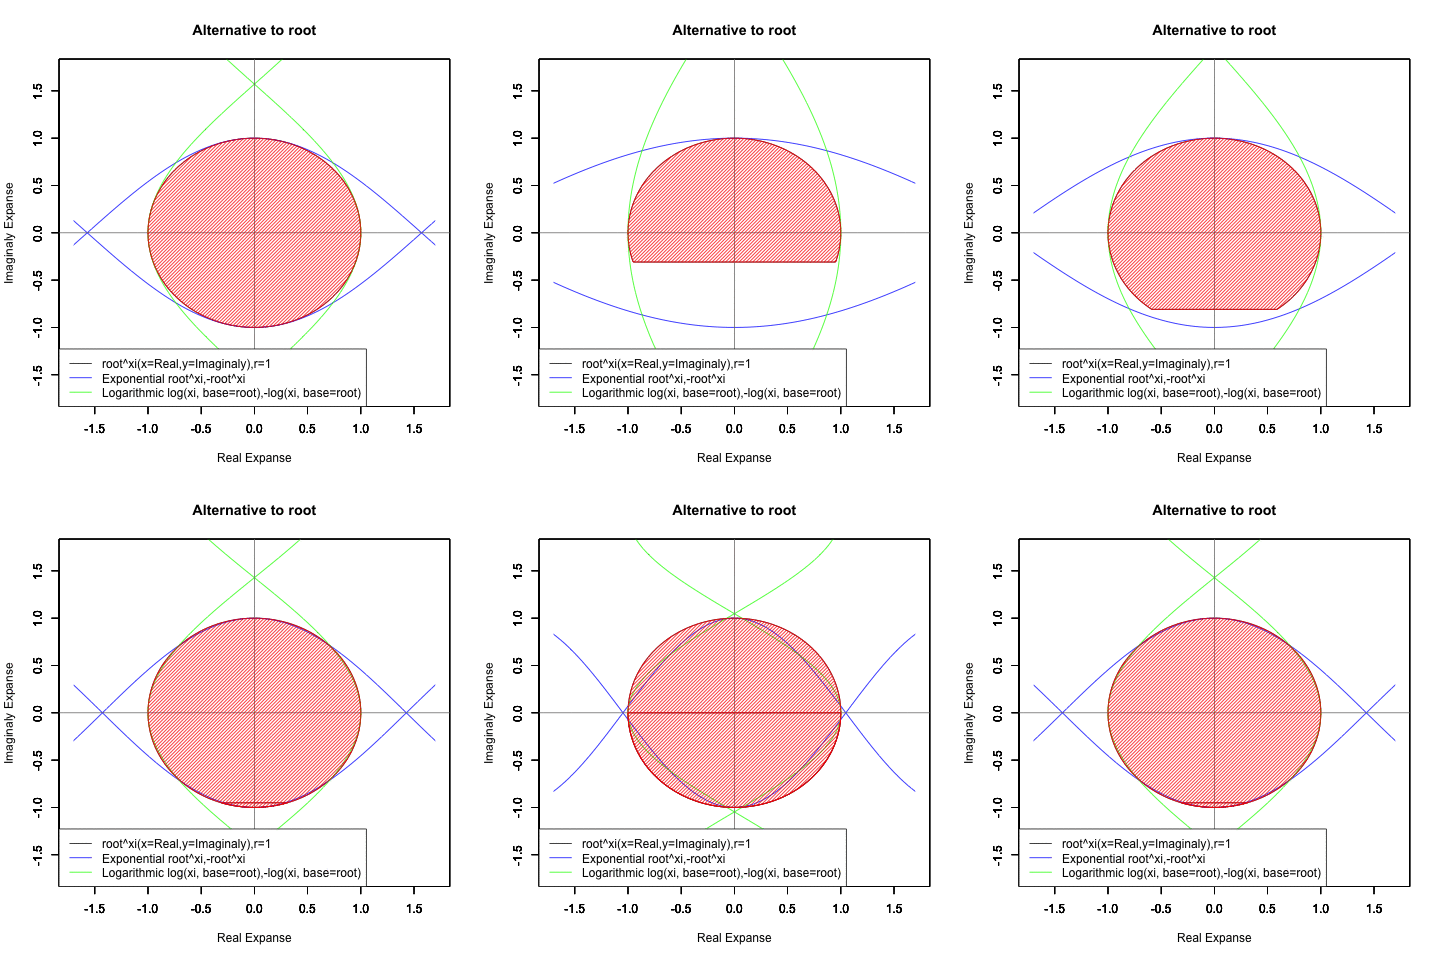
これは、これは…ならば、もっと思い切って底(root)を動かしてみたら?
統計言語Rによる実演例
root_move<-function(rp){
#タイトル定義
Main_title<-c("Alternative to root")
x_title<-c("Real Expanse")
y_title<-c("Imaginaly Expanse")
#関数定義
f1<-function(x){rp^(x*(0+1i))}
theta <- c(seq(0, pi, length=180),seq(-pi, 0, length=180))
Circle_x=Im(f1(theta))
Circle_y=Re(f1(theta))f2<-function(x){-rp^(x*(0+1i))}
#f3<-function(x){log(x*(0+1i))}
cnv_y <- c(seq(-3, 3, length=300))
Log_plus <- f1(cnv_y)
#f4<-function(x){-log(x*(0+1i))}
Log_minus <-f2(cnv_y)
#f5<-function(x){2*x^2}
#f6<-function(x){x^2}
#f7<-function(x){4*x+5}
#凡例用関数名定義
f1_name<-c("root^xi(x=Real,y=Imaginaly),r=1")
f2_name<-c("Exponential root^xi,-root^xi")
f3_name<-c("Logarithmic log(xi, base=root),-log(xi, base=root)")
#f4_name<-c("2*(x-3)^2")
#f5_name<-c("2*x^2")
#f6_name<-c("x^2")#グラフのスケール決定
gs_x<-c(-1.7,1.7)
gs_y<-c(-1.7,1.7)
#グラフの色の決定
Black<-rgb(0,0,0)
Red<-rgb(1,0,0)
Magenta<-rgb(1,0,1)
Blue<-rgb(0,0,1)
Green<-rgb(0,1,0)
Cyan<-rgb(0,1,1)
Yellow<-rgb(1,1,0)
Gray<-"#777777"
#グラフ描画
plot(Circle_x,Circle_y,xlim=gs_x,ylim=gs_y,type="l",col=Black, main=Main_title,xlab=x_title,ylab=y_title)
par(new=T)#上書き指定
plot(f1,xlim=gs_x,ylim=gs_y,type="l",col=Blue, main="",xlab="",ylab="")
par(new=T)#上書き指定
plot(f2,xlim=gs_x,ylim=gs_y,type="l",col=Blue, main="",xlab="",ylab="")
par(new=T)#上書き指定
plot(Log_plus, cnv_y,xlim=gs_x,ylim=gs_y,type="l",col=Green, main="",xlab="",ylab="")
par(new=T)#上書き指定
plot(Log_minus,cnv_y,xlim=gs_x,ylim=gs_y,type="l",col=Green, main="",xlab="",ylab="")
par(new=T)#上書き指定
#plot(Circle_x*sqrt(2.5),Circle_y*sqrt(2.5),xlim=gs_x,ylim=gs_y,type="l",col=Gray, main="",xlab="",ylab="")
#par(new=T)#上書き指定
#plot(f6,xlim=gs_x,ylim=gs_y,type="l",col=Yellow, main="",xlab="",ylab="")
#par(new=T)#上書き指定
#plot(f7,xlim=gs_x,ylim=gs_y,type="l",col=Blue, main="",xlab="",ylab="")#基準線
abline(h=0,,col=Gray)
abline(v=0,,col=Gray)
#塗りつぶし
polygon(c(Circle_x), #x
c(Circle_y), #y
density=c(30), #塗りつぶす濃度
angle=c(45), #塗りつぶす斜線の角度
col=segC)
#凡例描画
legend("bottomleft", legend=c(f1_name,f2_name,f3_name),lty=c(1,1,1),col=c(Black,Blue,Green))
#legend("bottomleft", #legend=c(f1_name,f2_name,f3_name,f4_name,f5_name,f6_name),lty=c(1,1,1,1,1,1),col=c(Red,Magenta,Blue,Green,Cyan,Yellow))
}
library("animation")
Time_Code=c(exp(1.0),exp(0.9),exp(0.8),exp(0.7),exp(0.6),exp(0.5),exp(0.6),exp(0.7),exp(0.8),exp(0.9),exp(1.0),exp(1.1),exp(1.2),exp(1.3),exp(1.4),exp(1.5),exp(1.4),exp(1.3),exp(1.2),exp(1.1))
saveGIF({
for (i in Time_Code){
root_move(i)
}
}, interval = 0.1, movie.name = "TEST.gif")

とりあえず-1(1/root)から0(root/root)へのエリアと0から1(root)のエリアに
#-1から0へ
library("animation")
Time_Code=c(exp(0.0),exp(-0.1),exp(-0.2),exp(-0.3),exp(-0.4),exp(-0.5),exp(-0.5),exp(-0.6),exp(-0.7),exp(-0.8),exp(-0.9),exp(-1.0),exp(-0.9),exp(-0.8),exp(-0.7),exp(-0.6),exp(-0.5),exp(-0.4),exp(-0.3),exp(-0.2),exp(-0.1))
saveGIF({
for (i in Time_Code){
root_move(i)
}
}, interval = 0.1, movie.name = "TEST.gif")

#0から+1へ
library("animation")
Time_Code=c(exp(1.0),exp(0.9),exp(0.8),exp(0.7),exp(0.6),exp(0.5),exp(0.4),exp(0.3),exp(0.2),exp(0.1),exp(0),exp(0.1),exp(0.2),exp(0.3),exp(0.4),exp(0.5),exp(0.6),exp(0.7),exp(0.8),exp(0.9))
saveGIF({
for (i in Time_Code){
root_move(i)
}
}, interval = 0.1, movie.name = "TEST.gif")

#-1から0を経て+1へ
library("animation")
Time_Code=c(exp(0.0),exp(-0.1),exp(-0.2),exp(-0.3),exp(-0.4),exp(-0.5),exp(-0.5),exp(-0.6),exp(-0.7),exp(-0.8),exp(-0.9),exp(-1.0),exp(-0.9),exp(-0.8),exp(-0.7),exp(-0.6),exp(-0.5),exp(-0.4),exp(-0.3),exp(-0.2),exp(-0.1),exp(0.0),exp(0.1),exp(0.2),exp(0.3),exp(0.4),exp(0.5),exp(0.6),exp(0.7),exp(0.8),exp(0.9),exp(1.0),exp(0.9),exp(0.8),exp(0.7),exp(0.6),exp(0.5),exp(0.4),exp(0.3),exp(0.2),exp(0.1))
saveGIF({
for (i in Time_Code){
root_move(i)
}
}, interval = 0.1, movie.name = "TEST.gif")

#+1から+2へ
library("animation")
Time_Code=c(exp(1.0),exp(1.1),exp(1.2),exp(1.3),exp(1.4),exp(1.5),exp(1.6),exp(1.7),exp(1.8),exp(1.9),exp(2.0),exp(1.9),exp(1.8),exp(1.7),exp(1.6),exp(1.5),exp(1.4),exp(1.3),exp(1.2),exp(1.1))
saveGIF({
for (i in Time_Code){
root_move(i)
}
}, interval = 0.1, movie.name = "TEST.gif")

#-1から-2へ
library("animation")
Time_Code=c(exp(-1.0),exp(-1.1),exp(-1.2),exp(-1.3),exp(-1.4),exp(-1.5),exp(-1.6),exp(-1.7),exp(-1.8),exp(-1.9),exp(-2.0),exp(-1.9),exp(-1.8),exp(-1.7),exp(-1.6),exp(-1.5),exp(-1.4),exp(-1.3),exp(-1.2),exp(-1.1))
saveGIF({
for (i in Time_Code){
root_move(i)
}
}, interval = 0.1, movie.name = "TEST.gif")

どうやら、まだ複素平面には私の知らない側面が隠れている様なのです…