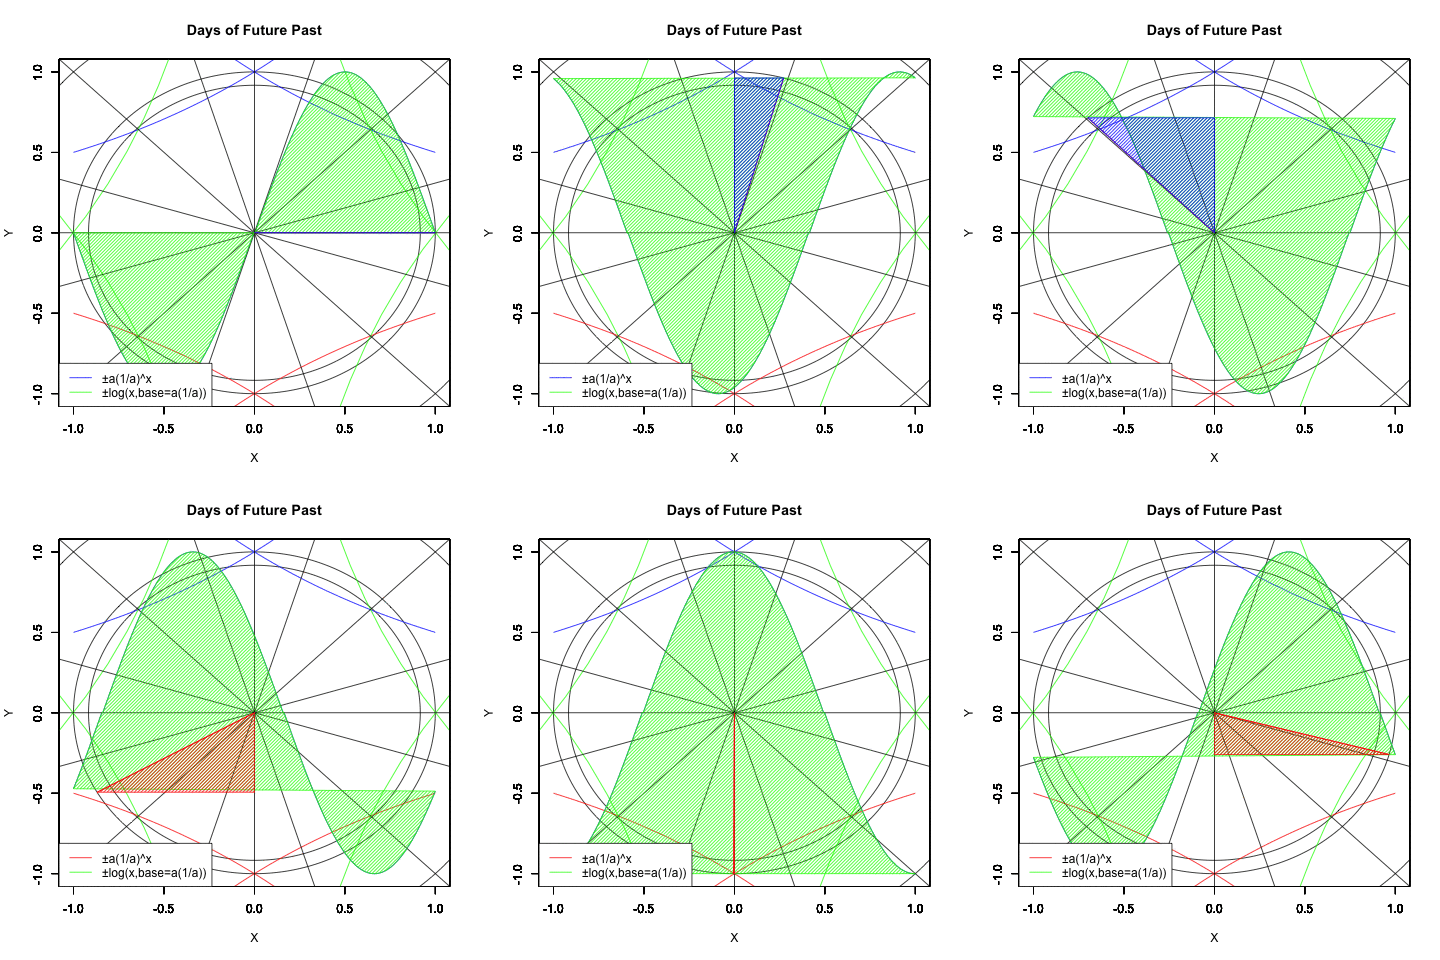
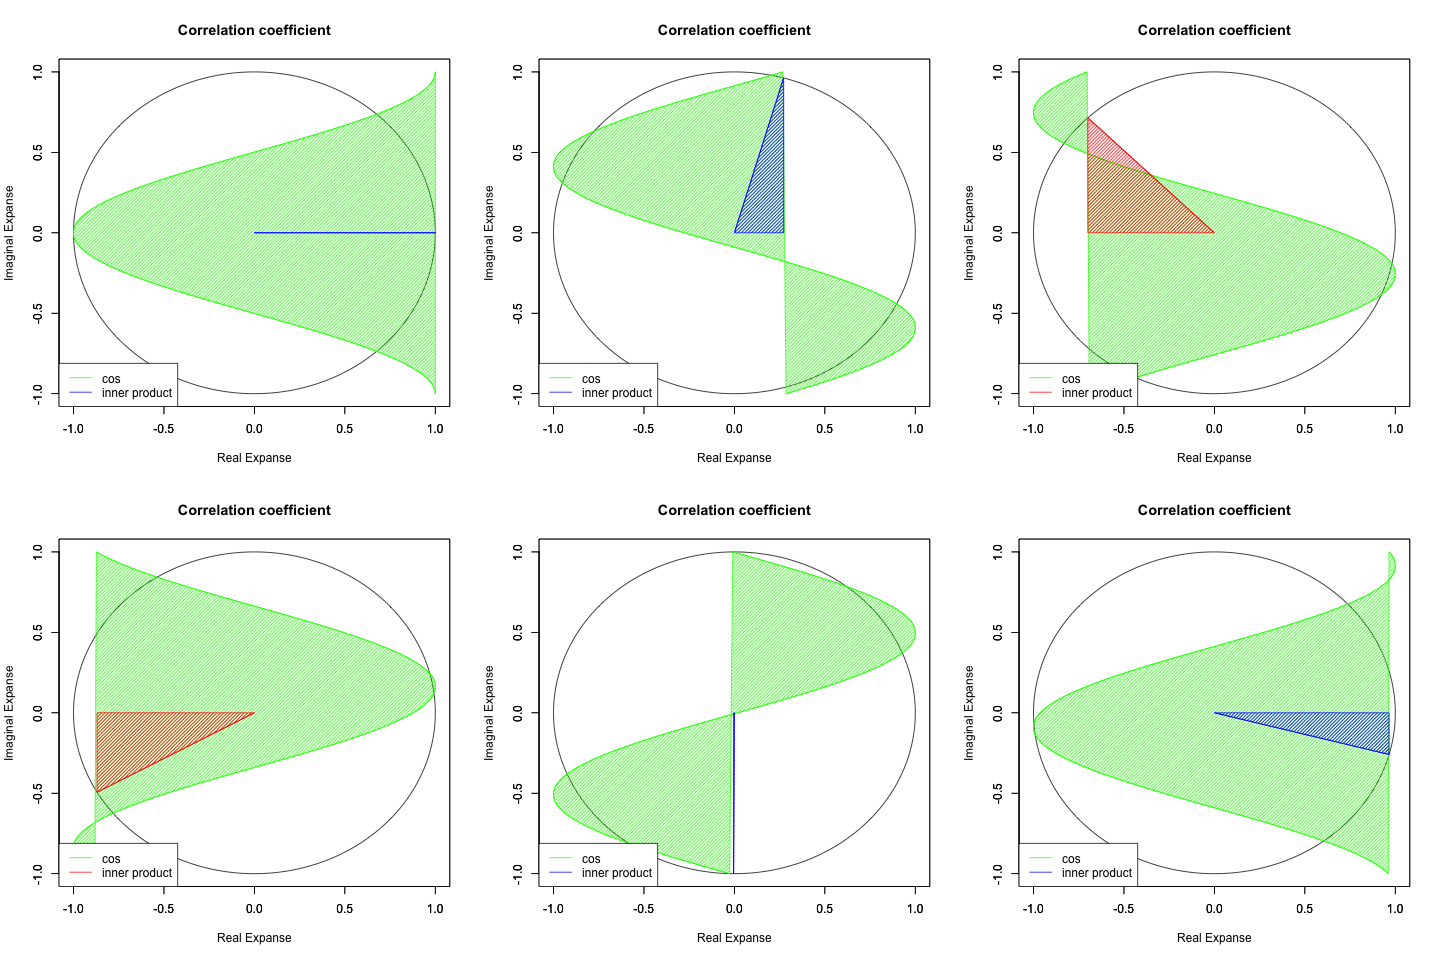
オイラーの等式e^πi=(1+πi/N)^N=(1+πi/N)^N=1+πi=-1(フルで全貌について触れようとするとこんな感じになる)の成立は、以下の意味合いにおいて歴史的画期となりました。

- ネイピア数eを底とする指数関数e^xや対数関数log(x)(x=a^y)の座標との関係が曖昧なのを利用して(指数関数や対数関数に現れる)対数尺度と(N次元の評価軸で構成される直交座標系が立脚する)等間隔尺度と(三角関数などが立脚する)極座標系を解析接続。これら三つの座標系を束ねるのは「半径1の基本円/球」だが、実は指数関数・対数関数における「1」は底(root)/底(root)の座標に点として現れるに過ぎない。
*その一方で指数関数・対数関数の世界では指数-1の2乗は-2になるだけ。0から-1の区間の数理だけ取り出しても他とは全く異なっている。

- この程度の事は「無視可能(Ignorable)」と信じられるほど、指数関数や対数関数の導出式(1±πi/N)^Nと、ピタゴラスの定理を応用した円関数の公式±sqrt(1-^2)(どちらも1と-1を極限とする)が重ね合わせ可能となる事は数学史上重要だったのです。そしてその結果オイラーの公式e^Θi=cos(Θ)+sin(Θ)iが成立し、この問題は周期関数の領域に足を踏み入れる事になったのでした。


- 人呼んで「オイラーの方便」? まぁ実際の人間は(カンブリア爆発期(約5億4200万年前〜約4億8830万年前)以降、動きの鈍重な放射相称動物(Radiata、ウニやクラゲやイソギンチャクの類)から明確に分離して「目と視覚情報を処理する脊椎」を備えた左右相称動物(Bilateria、カニやエビの様な節足動物の先祖筋)が分化して「観測原点をすっぽり包む全球型スクリーン」に自らの生存可能性を委ねる様になって以降の伝統に従って)片対数尺の世界を生きているのであって、その意味ではむしろN次元の評価軸で構成される直交座標系(rectangular coordinate system/orthogonal coordinate system)や、各観察対象を距離と角度で把握する極座標系(polar coordinates system)の方が、生物の脳内にしか存在しない「虚数解(Imaginary Solution)」の名前に相応しいかもしれないのです。
FPSとは?www #R6S pic.twitter.com/WblHFIcP3O
— rei@でく (@rei_de9) May 15, 2019このお楽しみはN-1の機体も景色も広く見えるからTPSのほうが良いかもしれない!
— k a (@ka0469) May 15, 2019
#swbf2 #PS4sharehttps://t.co/Vpqb0qG8RE pic.twitter.com/ARQe4aMdJ2 - こうして数学の世界が「一番美味しい所」を持っていった結果残ったのが、それまで数学者達に数多くの直感を授けてきた「(カンブリア爆発期(約5億4200万年前〜約4億8830万年前)以降、動きの鈍重な放射相称動物(Radiata、ウニやクラゲやイソギンチャクの類)から明確に分離して「目と視覚情報を処理する脊椎」を備えた左右相称動物(Bilateria、カニやエビの様な節足動物の先祖筋)が分化して「観測原点をすっぽり包む全球型スクリーン」に自らの生存可能性を委ねる様になって以降の伝統に従った)オイラーの原始量(Euler's primitive sweep)=観測原点をすっぽり包む全球型スクリーン」となる。オイラーの公式e^Θi=cos(Θ)+sin(Θ)iを「我々の至宝」かつ「すべての数学のなかでもっとも素晴らしい公式」と褒めそやしたファインマンの経路積分は、世界を「ニュートン物理学の成立するサイズ」と「(微小過ぎてそれが通用しなくなった)量子力学の成立するサイズ」に2分するだけだが、実際の我々の脳内にプレインストールされたそれは芸術やCGI(Computer Generated Imagery)映像作品や漫画やアニメにおけるデフォルメ表現の源ともなってきたのだった。

で、最近オイラーの等式e^πi=(1+πi/N)^N=(1+πi/N)^N=1+πi=-1のNの数が極端に少ないと起こるオイラーの原始量(Euler's primitive sweep)のある種の量子力学的状態について以下の様な経験をしたので報告します。
まぁ、この投稿の中で「半径の旋回が円の面積となり、その円の旋回がさらに球の体積となる」光景のアニメ化を目指した訳なんですが…
統計言語Rによる検証例(円から球の表面積へ)本番
#複素平面(球面)
Complex_plane<-function(x){
#グラフのスケール決定
Graph_scale_x<-c(-1,1)
Graph_scale_y<-c(-1,1)
#円弧描写の準備
theta <- c(seq(0, pi, length=180),seq(-pi, 0, length=180))
dr<-seq(0,2*pi,length=360)
theta00<- seq(1, -1, length=360)
theta01 <- c(theta[x:360],theta[1:x-1])
theta_sin<-sin(theta01)
#方向の正負(右が緑、左が赤)htc=seq(1:360)
htcval=c(seq(1,0,length=90),seq(0,1,length=90),seq(1,0,length=90),seq(0,1,length=90))
Rotation_ratio<-htcval[c(x)]
ifelse*1
ifelse*2
ifelse*3
ifelse*4
theta02_sin<-sin(theta02)
#円弧の描写plot(cos(theta), sin(theta), xlim=Graph_scale_x,ylim=Graph_scale_y,type="l",col=rgb(0,0,0), main="Sphere area", xlab="X", ylab="Y")
par(new=T)#上書き指定plot(f0, xlim=Graph_scale_x,ylim=Graph_scale_y,type="l",col=C_Top,main="", xlab="", ylab="")
par(new=T)#上書き指定
plot(f1, xlim=Graph_scale_x,ylim=Graph_scale_y,type="l",col=C_Bottom,main="", xlab="", ylab="")#インジケーター
segments(cos(dr[x])*Rotation_ratio,sin(dr[x]),0,0,col=segC)
#polygon(c(theta02_cos,0), #x
#c(theta02_sin,0), #y
#density=c(30), #塗りつぶす濃度
#angle=c(45), #塗りつぶす斜線の角度
#col=segC) #塗りつぶす色}
#アニメーションさせてみる。library("animation")
#Time_Code=c(1,90,180,270)
Time_Code=c(1,15,30,45,60,75,90,105,120,135,150,165,180,195,210,225,240,255,270,285,300,315,330,345)
saveGIF({
for (i in Time_Code){
Complex_plane(i)
}
}, interval = 0.1, movie.name = "TEST.gif")

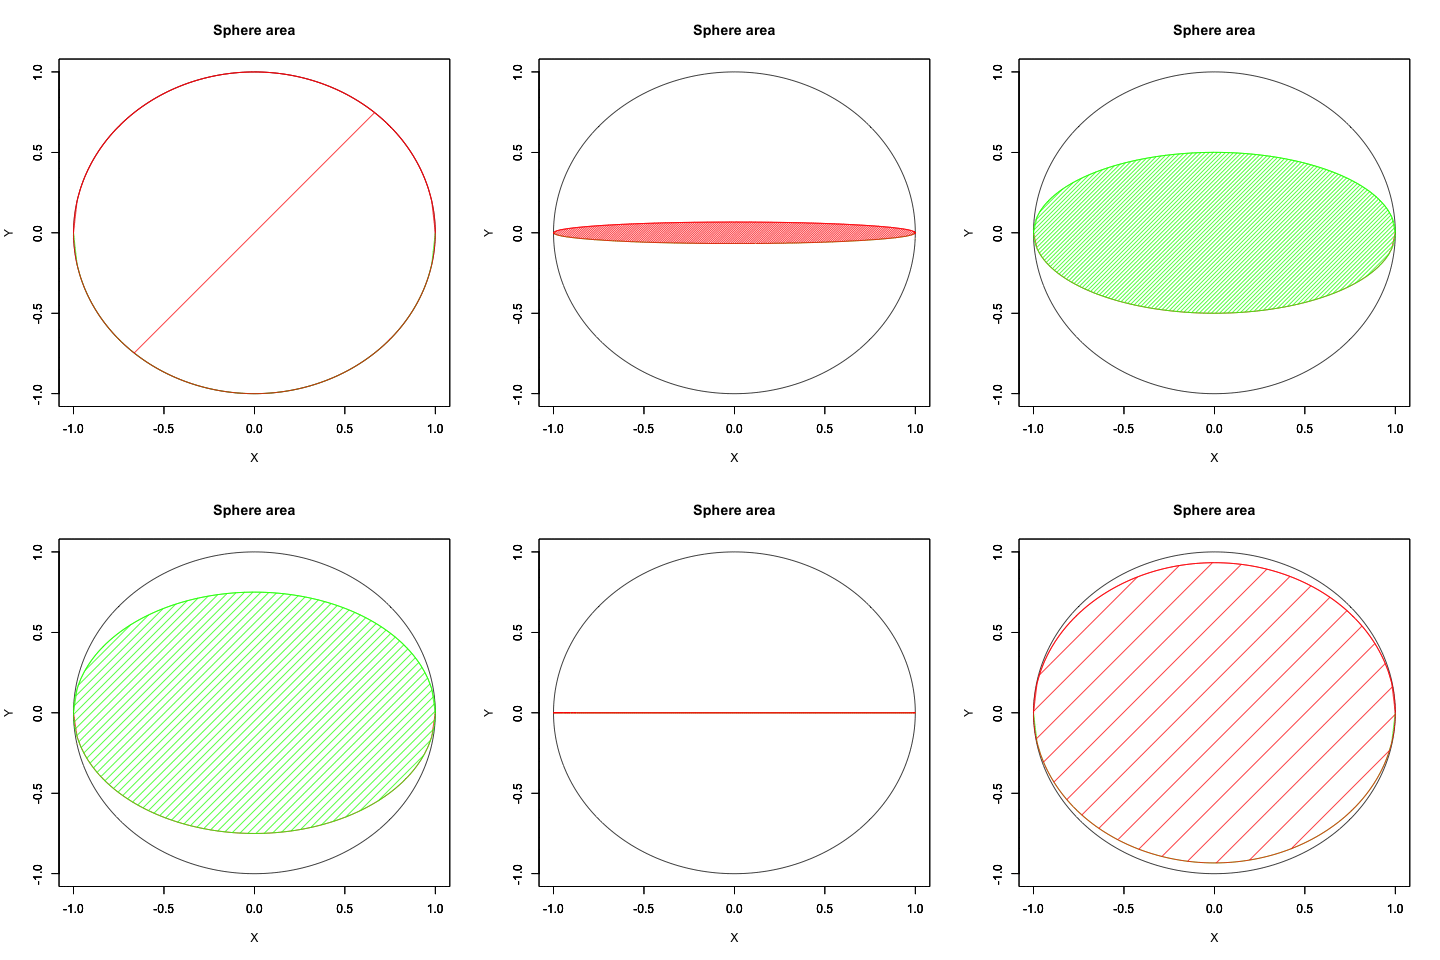
まぁ、ただ単色の円を回しただけでは何が何だか分かりません。それで「右(手前)は緑」「左(奥)は赤」というルールを導入してみた訳ですが…
統計言語Rによる検証例(円から球の表面積へ)本番
#複素平面(球面)
Complex_plane<-function(x){
#グラフのスケール決定
Graph_scale_x<-c(-1,1)
Graph_scale_y<-c(-1,1)
#円弧描写の準備
theta <- c(seq(0, pi, length=180),seq(-pi, 0, length=180))
dr<-seq(0,2*pi,length=360)
theta00<- seq(1, -1, length=360)
theta01 <- c(theta[x:360],theta[1:x-1])
theta_sin<-sin(theta01)
#方向の正負(右が緑、左が赤)htc=seq(1:360)
htc_
htcval=c(seq(1,0,length=90),seq(0,1,length=90),seq(1,0,length=90),seq(0,1,length=90))
Rotation_ratio<-htcval[c(x)]
ifelse*5
ifelse*6
ifelse*7
ifelse*8
theta02_sin<-sin(theta02)
#円弧の描写plot(cos(theta), sin(theta), xlim=Graph_scale_x,ylim=Graph_scale_y,type="l",col=rgb(0,0,0), main="Sphere area", xlab="X", ylab="Y")
par(new=T)#上書き指定plot(f0, xlim=Graph_scale_x,ylim=Graph_scale_y,type="l",col=C_Top,main="", xlab="", ylab="")
par(new=T)#上書き指定
plot(f1, xlim=Graph_scale_x,ylim=Graph_scale_y,type="l",col=C_Bottom,main="", xlab="", ylab="")#インジケーター
Circle_paint
#segments(cos(dr[x])*Rotation_ratio,sin(dr[x]),0,0,col=segC)
polygon(c(theta02_cos,0), #x
#c(theta02_sin,0), #y
#density=c(30), #塗りつぶす濃度
#angle=c(45), #塗りつぶす斜線の角度
#col=segC) #塗りつぶす色}
#アニメーションさせてみる。library("animation")
#Time_Code=c(1,90,180,270)
Time_Code=c(1,15,30,45,60,75,90,105,120,135,150,165,180,195,210,225,240,255,270,285,300,315,330,345)
saveGIF({
for (i in Time_Code){
Complex_plane(i)
}
}, interval = 0.1, movie.name = "TEST.gif")

統計言語Rによる検証例(円の面積から球の表面積へ)
#複素平面(球面)
Complex_plane<-function(x){
#グラフのスケール決定
Graph_scale_x<-c(-1,1)
Graph_scale_y<-c(-1,1)
#円弧描写の準備
theta <- c(seq(0, pi, length=180),seq(-pi, 0, length=180))
theta00<- seq(1, -1, length=360)
theta01 <- c(theta[x:360],theta[1:x-1])
theta_sin<-sin(theta01)
#方向の正負(右が緑、左が赤)
htc=seq(1:360)
htcval=c(seq(1,0,length=90),seq(0,1,length=90),seq(1,0,length=90),seq(0,1,length=90))
Rotation_ratio<-htcval[c(x)]
htcval_sin=sin(theta)
htcval_cos=cos(theta)*Rotation_ratio
ifelse*9
ifelse*10
f0<-function(x){sqrt(1-x^2)*Rotation_ratio}
f1<-function(x){-sqrt(1-x^2)*Rotation_ratio}
#円弧の描写(ベース)
plot(cos(theta), sin(theta), xlim=Graph_scale_x,ylim=Graph_scale_y,type="l",col=rgb(0,0,0), main="Sphere area", xlab="X", ylab="Y")
par(new=T)#上書き指定
#円弧の描写(回転)
plot(f0,xlim=Graph_scale_x,ylim=Graph_scale_y,type="l",col=C_Top,main="", xlab="", ylab="")
par(new=T)#上書き指定
plot(f1,xlim=Graph_scale_x,ylim=Graph_scale_y,type="l",col=C_Bottom,main="", xlab="", ylab="")
#円の塗り潰し
polygon(htcval_sin, #x
htcval_cos, #y
density=c(30), #塗りつぶす濃度
angle=c(45), #塗りつぶす斜線の角度
col=C_Top) #塗りつぶす色
}
#アニメーションさせてみる。library("animation")
Time_Code=c(1,15,30,45,60,75,90,105,120,135,150,165,180,195,210,225,240,255,270,285,300,315,330,345)
saveGIF({
for (i in Time_Code){
Complex_plane(i)
}
}, interval = 0.1, movie.name = "TEST.gif")

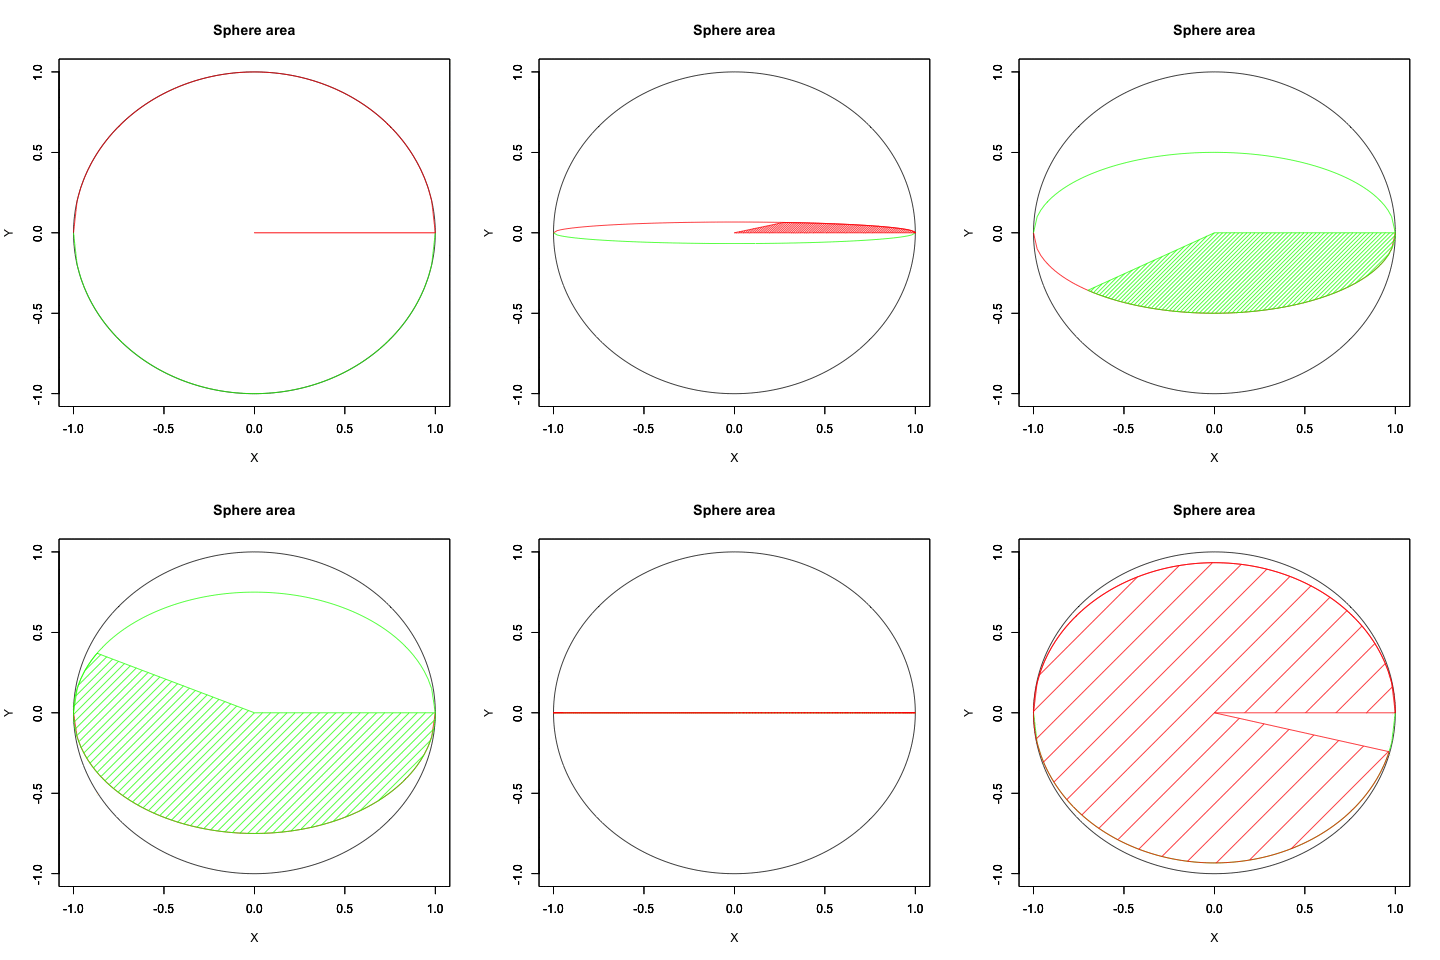
まだまだ何が何だかさっぱり…それで「合わせ技」 の導入を判断。
統計言語Rによる検証例(円から球の表面積へ)本番
#複素平面(球面)
Complex_plane<-function(x){
#グラフのスケール決定
Graph_scale_x<-c(-1,1)
Graph_scale_y<-c(-1,1)
#円弧描写の準備
theta <- c(seq(0, pi, length=180),seq(-pi, 0, length=180))
dr<-seq(0,2*pi,length=360)
theta00<- seq(1, -1, length=360)
theta01 <- c(theta[x:360],theta[1:x-1])
theta_sin<-sin(theta01)
#方向の正負(右が緑、左が赤)htc=seq(1:360)
htcval=c(seq(1,0,length=90),seq(0,1,length=90),seq(1,0,length=90),seq(0,1,length=90))
Rotation_ratio<-htcval[c(x)]
ifelse*11
theta02<-dr[1:x]
ifelse*12
ifelse*13
f0<-function(x){sqrt(1-x^2)*Rotation_ratio}
f1<-function(x){-sqrt(1-x^2)*Rotation_ratio}theta02_cos<-cos(theta02)
theta02_sin<-sin(theta02)*Rotation_ratio
#円弧の描写plot(cos(theta), sin(theta), xlim=Graph_scale_x,ylim=Graph_scale_y,type="l",col=rgb(0,0,0), main="Sphere area", xlab="X", ylab="Y")
par(new=T)#上書き指定plot(f0, xlim=Graph_scale_x,ylim=Graph_scale_y,type="l",col=C_Top,main="", xlab="", ylab="")
par(new=T)#上書き指定
plot(f1, xlim=Graph_scale_x,ylim=Graph_scale_y,type="l",col=C_Bottom,main="", xlab="", ylab="")#インジケーター
segments(cos(dr[x]),sin(dr[x])*Rotation_ratio,0,0,col=segC)
polygon(c(0,theta02_cos), #x
c(0,theta02_sin), #y
density=c(30), #塗りつぶす濃度
angle=c(45), #塗りつぶす斜線の角度
col=segC) #塗りつぶす色}
#アニメーションさせてみる。library("animation")
Time_Code=c(1,15,30,45,60,75,90,105,120,135,150,165,180,195,210,225,240,255,270,285,300,315,330,345)
saveGIF({
for (i in Time_Code){
Complex_plane(i)
}
}, interval = 0.1, movie.name = "TEST.gif")

顕現したのは完全なるカオス状態…
統計言語Rによる検証例(円から球の表面積へ)本番
#複素平面(球面)
Complex_plane<-function(x){
#グラフのスケール決定
Graph_scale_x<-c(-1,1)
Graph_scale_y<-c(-1,1)
#円弧描写の準備
theta <- c(seq(0, pi, length=180),seq(-pi, 0, length=180))
dr<-seq(0,2*pi,length=360)
theta00<- seq(1, -1, length=360)
theta01 <- c(theta[x:360],theta[1:x-1])
theta_sin<-sin(theta01)
#方向の正負(右が緑、左が赤)htc=seq(1:360)
htcval=c(seq(1,0,length=90),seq(0,1,length=90),seq(1,0,length=90),seq(0,1,length=90))
Rotation_ratio<-htcval[c(x)]
ifelse*14
theta02<-dr[1:x]
ifelse*15
ifelse*16
f0<-function(x){sqrt(1-x^2)*Rotation_ratio}
f1<-function(x){-sqrt(1-x^2)*Rotation_ratio}theta02_cos<-cos(theta02)
ifelse*17
plot(htc,htcval,xlim=c(0,360),ylim=c(0,1),type="l",main="Quadrant",xlab="X", ylab="Y")

この直線的動きが不自然さの原因の一つかとも考え、コサイン関数への置換を検討。
統計言語Rによるコサイン関数の検証
#基本形はこんな感じ
cos2<-function(x){cos(x)}
plot(cos2,xlim=c(0,6),ylim=c(-1,1),type="l",main="Cosin Function",xlab="X", ylab="Y")

#cos(x)/aで振幅に影響が与えられる。
cos2<-function(x){cos(x)/2}
plot(cos2,xlim=c(0,6),ylim=c(-1,1),type="l",main="Cosin Function",xlab="X", ylab="Y")

#cos(x*a)で周期に影響が与えられる。
cos2<-function(x){cos(x/2)}
plot(cos2,xlim=c(0,6),ylim=c(-1,1),type="l",main="Cosin Function",xlab="X", ylab="Y")

#ただ振幅と周期をいじっただけでは展開範囲が合わない。
cos2<-function(x){cos(x*2)}
plot(cos2,xlim=c(0,6),ylim=c(-1,1),type="l",main="Cosin Function",xlab="X", ylab="Y")

#で、これが最終形
cos2<-function(x){cos(2*x/360*2*pi)/2+0.5}
plot(cos2,xlim=c(0,360),ylim=c(0,1),type="l",main="Cosin Function",xlab="X", ylab="Y")

「最終形」の元プログラムへの反映結果(円の面積から球の表面積へ)
#複素平面(球面)
Complex_plane<-function(x){
#グラフのスケール決定
Graph_scale_x<-c(-1,1)
Graph_scale_y<-c(-1,1)
#円弧描写の準備
theta <- c(seq(0, pi, length=180),seq(-pi, 0, length=180))
theta00<- seq(1, -1, length=360)
theta01 <- c(theta[x:360],theta[1:x-1])
theta_sin<-sin(theta01)
#方向の正負(右が緑、左が赤)
htc=seq(1:360)
cos2<-function(x){cos(2*x/360*2*pi)/2+0.5}
htcval=cos2(htc)
Rotation_ratio<-htcval[c(x)]
htcval_sin=sin(theta)
htcval_cos=cos(theta)*Rotation_ratio
ifelse*18
ifelse*19
f0<-function(x){sqrt(1-x^2)*Rotation_ratio}
f1<-function(x){-sqrt(1-x^2)*Rotation_ratio}
#円弧の描写(ベース)
plot(cos(theta), sin(theta), xlim=Graph_scale_x,ylim=Graph_scale_y,type="l",col=rgb(0,0,0), main="Sphere area", xlab="X", ylab="Y")
par(new=T)#上書き指定
#円弧の描写(回転)
plot(f0,xlim=Graph_scale_x,ylim=Graph_scale_y,type="l",col=C_Top,main="", xlab="", ylab="")
par(new=T)#上書き指定
plot(f1,xlim=Graph_scale_x,ylim=Graph_scale_y,type="l",col=C_Bottom,main="", xlab="", ylab="")
#円の塗り潰し
polygon(htcval_sin, #x
htcval_cos, #y
density=c(30), #塗りつぶす濃度
angle=c(45), #塗りつぶす斜線の角度
col=C_Top) #塗りつぶす色
}
#アニメーションさせてみる。library("animation")
Time_Code=c(1,15,30,45,60,75,90,105,120,135,150,165,180,195,210,225,240,255,270,285,300,315,330,345)
saveGIF({
for (i in Time_Code){
Complex_plane(i)
}
}, interval = 0.1, movie.name = "TEST.gif")

「最終形」の元プログラムへの反映結果(合わせ技)
#複素平面(球面)
Complex_plane<-function(x){
#グラフのスケール決定
Graph_scale_x<-c(-1,1)
Graph_scale_y<-c(-1,1)
#円弧描写の準備
theta <- c(seq(0, pi, length=180),seq(-pi, 0, length=180))
dr<-seq(0,2*pi,length=360)
theta00<- seq(1, -1, length=360)
theta01 <- c(theta[x:360],theta[1:x-1])
theta_sin<-sin(theta01)
#方向の正負(右が緑、左が赤)htc=seq(1:360)
cos2<-function(x){cos(2*x/360*2*pi)/2+0.5}
htcval=cos2(htc)
Rotation_ratio<-htcval[c(x)]
ifelse*20
theta02<-dr[1:x]
ifelse*21
ifelse*22
f0<-function(x){sqrt(1-x^2)*Rotation_ratio}
f1<-function(x){-sqrt(1-x^2)*Rotation_ratio}theta02_cos<-cos(theta02)
ifelse*23
theta00<- seq(1, -1, length=360)
theta01 <- c(theta[x:360],theta[1:x-1])
theta_sin<-sin(theta01)
#方向の正負(右が緑、左が赤)
htc=seq(1:360)
cos2<-function(x){cos(2*x/360*2*pi)/2+0.5}
htcval=cos2(htc)
Rotation_ratio<-htcval[c(x)]
htcval_sin=sin(theta)
htcval_cos=cos(theta)*Rotation_ratio
ifelse*24
ifelse*25
f0<-function(x){sqrt(1-x^2)*Rotation_ratio}
f1<-function(x){-sqrt(1-x^2)*Rotation_ratio}
#円弧の描写(ベース)
plot(cos(theta), sin(theta), xlim=Graph_scale_x,ylim=Graph_scale_y,type="l",col=rgb(0,0,0), main="Sphere area", xlab="X", ylab="Y")
par(new=T)#上書き指定
#円弧の描写(回転)
plot(f0,xlim=Graph_scale_x,ylim=Graph_scale_y,type="l",col=C_Top,main="", xlab="", ylab="")
par(new=T)#上書き指定
plot(f1,xlim=Graph_scale_x,ylim=Graph_scale_y,type="l",col=C_Bottom,main="", xlab="", ylab="")
#円の塗り潰し
polygon(htcval_sin, #x
htcval_cos, #y
density=c(30), #塗りつぶす濃度
angle=c(45), #塗りつぶす斜線の角度
col=C_Top) #塗りつぶす色
}
#アニメーションさせてみる。library("animation")
Time_Code=c(1,15,30,45,60,75,90,105,120,135,150,165,180,195,210,225,240,255,270,285,300,315,330,345)
saveGIF({
for (i in Time_Code){
Complex_plane(i)
}
}, interval = 0.1, movie.name = "TEST.gif")

さらに塗りの濃度までいじってみたのが以下。
#複素平面(球面)
Complex_plane<-function(x){
#グラフのスケール決定
Graph_scale_x<-c(-1,1)
Graph_scale_y<-c(-1,1)
#円弧描写の準備
theta <- c(seq(0, pi, length=180),seq(-pi, 0, length=180))
theta00<- seq(1, -1, length=360)
theta01 <- c(theta[x:360],theta[1:x-1])
theta_sin<-sin(theta01)
#方向の正負(右が緑、左が赤)
htc=seq(1:360)
cos2<-function(x){cos(2*x/360*2*pi)/2+0.5}
htcval=cos2(htc)
Rotation_ratio<-htcval[c(x)]
htcval_sin=sin(theta)
htcval_cos=cos(theta)*Rotation_ratio
ifelse*26
ifelse*27
f0<-function(x){sqrt(1-x^2)*Rotation_ratio}
f1<-function(x){-sqrt(1-x^2)*Rotation_ratio}
#円弧の描写(ベース)
plot(cos(theta), sin(theta), xlim=Graph_scale_x,ylim=Graph_scale_y,type="l",col=rgb(0,0,0), main="Sphere area", xlab="X", ylab="Y")
par(new=T)#上書き指定
#円弧の描写(回転)
plot(f0,xlim=Graph_scale_x,ylim=Graph_scale_y,type="l",col=C_Top,main="", xlab="", ylab="")
par(new=T)#上書き指定
plot(f1,xlim=Graph_scale_x,ylim=Graph_scale_y,type="l",col=C_Bottom,main="", xlab="", ylab="")
#円の塗り潰し
polygon(htcval_sin, #x
htcval_cos, #y
density=c(50*(1-Rotation_ratio)), #塗りつぶす濃度
angle=c(45), #塗りつぶす斜線の角度
col=C_Top) #塗りつぶす色
}
#アニメーションさせてみる。library("animation")
Time_Code=c(1,15,30,45,60,75,90,105,120,135,150,165,180,195,210,225,240,255,270,285,300,315,330,345)
saveGIF({
for (i in Time_Code){
Complex_plane(i)
}
}, interval = 0.1, movie.name = "TEST.gif")

「最終形」の元プログラムへの反映結果(合わせ技)
#複素平面(球面)
Complex_plane<-function(x){
#グラフのスケール決定
Graph_scale_x<-c(-1,1)
Graph_scale_y<-c(-1,1)
#円弧描写の準備
theta <- c(seq(0, pi, length=180),seq(-pi, 0, length=180))
dr<-seq(0,2*pi,length=360)
theta00<- seq(1, -1, length=360)
theta01 <- c(theta[x:360],theta[1:x-1])
theta_sin<-sin(theta01)
#方向の正負(右が緑、左が赤)htc=seq(1:360)
cos2<-function(x){cos(2*x/360*2*pi)/2+0.5}
htcval=cos2(htc)
Rotation_ratio<-htcval[c(x)]
ifelse*28
theta02<-dr[1:x]
ifelse*29
ifelse*30
f0<-function(x){sqrt(1-x^2)*Rotation_ratio}
f1<-function(x){-sqrt(1-x^2)*Rotation_ratio}theta02_cos<-cos(theta02)
ifelse*31, #塗りつぶす濃度
angle=c(45), #塗りつぶす斜線の角度
col=segC) #塗りつぶす色}
#アニメーションさせてみる。library("animation")
Time_Code=c(1,15,30,45,60,75,90,105,120,135,150,165,180,195,210,225,240,255,270,285,300,315,330,345)
saveGIF({
for (i in Time_Code){
Complex_plane(i)
}
}, interval = 0.1, movie.name = "TEST.gif")

少しは自然な動きに近づいたでしょうか? はっきりいって内容的にはアニメーターの見習い修行に大差をつけられた感じ。でもまさに「オイラーの原始量(Euler's primitive sweep)=観測原点をすっぽり包む全球型スクリーン」の本質に触れるかの様な興味深い経験となったのでした。
*1:x%/%90==0 || x%/%90==3),C_Top<-rgb(1,0,0),C_Top<-rgb(0,1,0
*2:x%/%90==0 || x%/%90==3),C_Bottom<-rgb(0,1,0),C_Bottom<-rgb(1,0,0
*3:x>180),segC<-rgb(0,1,0),segC<-rgb(1,0,0
*4:x>180),theta02<-dr[181:x],theta02<-dr[1:x])
f0<-function(x){sqrt(1-x^2)*Rotation_ratio}
f1<-function(x){-sqrt(1-x^2)*Rotation_ratio}
ifelse((x>180),theta02_cos<-f0(theta02),theta02_cos<-f1(theta02
*5:x%/%90==0 || x%/%90==3),C_Top<-rgb(1,0,0),C_Top<-rgb(0,1,0
*6:x%/%90==0 || x%/%90==3),C_Bottom<-rgb(0,1,0),C_Bottom<-rgb(1,0,0
*7:x>180),segC<-rgb(0,1,0),segC<-rgb(1,0,0
*8:x>180),theta02<-dr[181:x],theta02<-dr[1:x])
f0<-function(x){sqrt(1-x^2)*Rotation_ratio}
f1<-function(x){-sqrt(1-x^2)*Rotation_ratio}
ifelse((x>180),theta02_cos<-f0(theta02),theta02_cos<-f1(theta02
*9:x%/%90==0 || x%/%90==3),C_Top<-rgb(1,0,0),C_Top<-rgb(0,1,0
*10:x%/%90==0 || x%/%90==3),C_Bottom<-rgb(0,1,0),C_Bottom<-rgb(1,0,0
*11:x%/%90==0 || x%/%90==2),segC<-rgb(1,0,0),segC<-rgb(0,1,0
*12:x%/%90==0 || x%/%90==3),C_Top<-rgb(1,0,0),C_Top<-rgb(0,1,0
*13:x%/%90==0 || x%/%90==3),C_Bottom<-rgb(0,1,0),C_Bottom<-rgb(1,0,0
*14:x%/%90==0 || x%/%90==2),segC<-rgb(1,0,0),segC<-rgb(0,1,0
*15:x%/%90==0 || x%/%90==3),C_Top<-rgb(1,0,0),C_Top<-rgb(0,1,0
*16:x%/%90==0 || x%/%90==3),C_Bottom<-rgb(0,1,0),C_Bottom<-rgb(1,0,0
*17:x%/%90==0 || x%/%90==3),theta02_sin<-sin(theta02)*Rotation_ratio,theta02_sin<-sin(theta02)*-Rotation_ratio)
#円弧の描写
plot(cos(theta), sin(theta), xlim=Graph_scale_x,ylim=Graph_scale_y,type="l",col=rgb(0,0,0), main="Sphere area", xlab="X", ylab="Y")
par(new=T)#上書き指定
plot(f0, xlim=Graph_scale_x,ylim=Graph_scale_y,type="l",col=C_Top,main="", xlab="", ylab="")
par(new=T)#上書き指定
plot(f1, xlim=Graph_scale_x,ylim=Graph_scale_y,type="l",col=C_Bottom,main="", xlab="", ylab="")
#インジケーター
#segments(cos(dr[x]),sin(dr[x])*Rotation_ratio,0,0,col=segC)
polygon(c(0,theta02_cos), #x
c(0,theta02_sin), #y
density=c(30), #塗りつぶす濃度
angle=c(45), #塗りつぶす斜線の角度
col=segC) #塗りつぶす色
}
#アニメーションさせてみる。
library("animation")
Time_Code=c(1,15,30,45,60,75,90,105,120,135,150,165,180,195,210,225,240,255,270,285,300,315,330,345)
saveGIF({
for (i in Time_Code){
Complex_plane(i)
}
}, interval = 0.1, movie.name = "TEST.gif")

ところでこれまでのグラフは以下の行列を使って円を回転させていたのです。
統計言語Rによる検証例(円から球の表面積へ)前準備
#円をX軸に沿って縦回転させる仕組み
htc=seq(1:360)
htcval=c(seq(1,0,length=90),seq(0,1,length=90),seq(1,0,length=90),seq(0,1,length=90*18:x%/%90==0 || x%/%90==3),C_Top<-rgb(1,0,0),C_Top<-rgb(0,1,0
*19:x%/%90==0 || x%/%90==3),C_Bottom<-rgb(0,1,0),C_Bottom<-rgb(1,0,0
*20:x%/%90==0 || x%/%90==3),segC<-rgb(1,0,0),segC<-rgb(0,1,0
*21:x%/%90==0 || x%/%90==3),C_Top<-rgb(1,0,0),C_Top<-rgb(0,1,0
*22:x%/%90==0 || x%/%90==3),C_Bottom<-rgb(0,1,0),C_Bottom<-rgb(1,0,0
*23:x%/%90==0 || x%/%90==3),theta02_sin<-sin(theta02)*Rotation_ratio,theta02_sin<-sin(theta02)*-Rotation_ratio)
#円弧の描写plot(cos(theta), sin(theta), xlim=Graph_scale_x,ylim=Graph_scale_y,type="l",col=rgb(0,0,0), main="Sphere area", xlab="X", ylab="Y")
par(new=T)#上書き指定plot(f0, xlim=Graph_scale_x,ylim=Graph_scale_y,type="l",col=C_Top,main="", xlab="", ylab="")
par(new=T)#上書き指定
plot(f1, xlim=Graph_scale_x,ylim=Graph_scale_y,type="l",col=C_Bottom,main="", xlab="", ylab="")#インジケーター
#segments(cos(dr[x]),sin(dr[x])*Rotation_ratio,0,0,col=segC)
polygon(c(0,theta02_cos), #x
c(0,theta02_sin), #y
density=c(30), #塗りつぶす濃度
angle=c(45), #塗りつぶす斜線の角度
col=segC) #塗りつぶす色}
#アニメーションさせてみる。library("animation")
Time_Code=c(1,15,30,45,60,75,90,105,120,135,150,165,180,195,210,225,240,255,270,285,300,315,330,345)
saveGIF({
for (i in Time_Code){
Complex_plane(i)
}
}, interval = 0.1, movie.name = "TEST.gif")

「最終形」の元プログラムへの反映結果(円の面積から球の表面積へ)
#複素平面(球面)
Complex_plane<-function(x){
#グラフのスケール決定
Graph_scale_x<-c(-1,1)
Graph_scale_y<-c(-1,1)
#円弧描写の準備
theta <- c(seq(0, pi, length=180),seq(-pi, 0, length=180*24:x%/%90==0 || x%/%90==3),C_Top<-rgb(1,0,0),C_Top<-rgb(0,1,0
*25:x%/%90==0 || x%/%90==3),C_Bottom<-rgb(0,1,0),C_Bottom<-rgb(1,0,0
*26:x%/%90==0 || x%/%90==3),C_Top<-rgb(1,0,0),C_Top<-rgb(0,1,0
*27:x%/%90==0 || x%/%90==3),C_Bottom<-rgb(0,1,0),C_Bottom<-rgb(1,0,0
*28:x%/%90==0 || x%/%90==3),segC<-rgb(1,0,0),segC<-rgb(0,1,0
*29:x%/%90==0 || x%/%90==3),C_Top<-rgb(1,0,0),C_Top<-rgb(0,1,0
*30:x%/%90==0 || x%/%90==3),C_Bottom<-rgb(0,1,0),C_Bottom<-rgb(1,0,0
*31:x%/%90==0 || x%/%90==3),theta02_sin<-sin(theta02)*Rotation_ratio,theta02_sin<-sin(theta02)*-Rotation_ratio)
#円弧の描写plot(cos(theta), sin(theta), xlim=Graph_scale_x,ylim=Graph_scale_y,type="l",col=rgb(0,0,0), main="Sphere area", xlab="X", ylab="Y")
par(new=T)#上書き指定plot(f0, xlim=Graph_scale_x,ylim=Graph_scale_y,type="l",col=C_Top,main="", xlab="", ylab="")
par(new=T)#上書き指定
plot(f1, xlim=Graph_scale_x,ylim=Graph_scale_y,type="l",col=C_Bottom,main="", xlab="", ylab="")#インジケーター
#segments(cos(dr[x]),sin(dr[x])*Rotation_ratio,0,0,col=segC)
polygon(c(0,theta02_cos), #x
c(0,theta02_sin), #y
density=c(50*(1-Rotation_ratio